Quantifying the total cost of payment acceptance
The cost of getting paid is not what most organizations think it is.
On the surface, the cost of accepting payments appears well understood. There are ACH fees, card processing fees and other transaction-related charges. Most organizations assume these represent the primary cost of payments. They do not.
The majority of payments are completed successfully, but a minority drive a disproportionate share of cost, effort and complexity—and those costs are largely created outside of the transaction itself.
When that minority occurs, a range of issues emerge:
- Payments are delayed or not completed at the time of intent
- Customers require assistance to complete payments
- Payments must be retried or recovered through additional effort
- Disputes arise, creating additional cost and operational overhead
Though central to completing the payment process, the costs of these situations are often not attributed to payments in financial reporting. In particular, any payment that requires human intervention introduces costs that organizations often fail to calculate.
The Payment Experience Gap
With this report, PayNearMe introduces the Payment Experience Gap: the difference between what bill pay businesses believe they pay to accept payments and the expenses they actually incur once the impacts of payment friction, customer support and operational costs are included.
A customer’s willingness and ability to pay ties directly to the payment experience. Systems that are difficult to use or offer limited payment options contribute to delayed or missed payments, increased support needs and higher operational burden. Over time, these issues inflate costs, hurt business metrics and damage customer relationships.
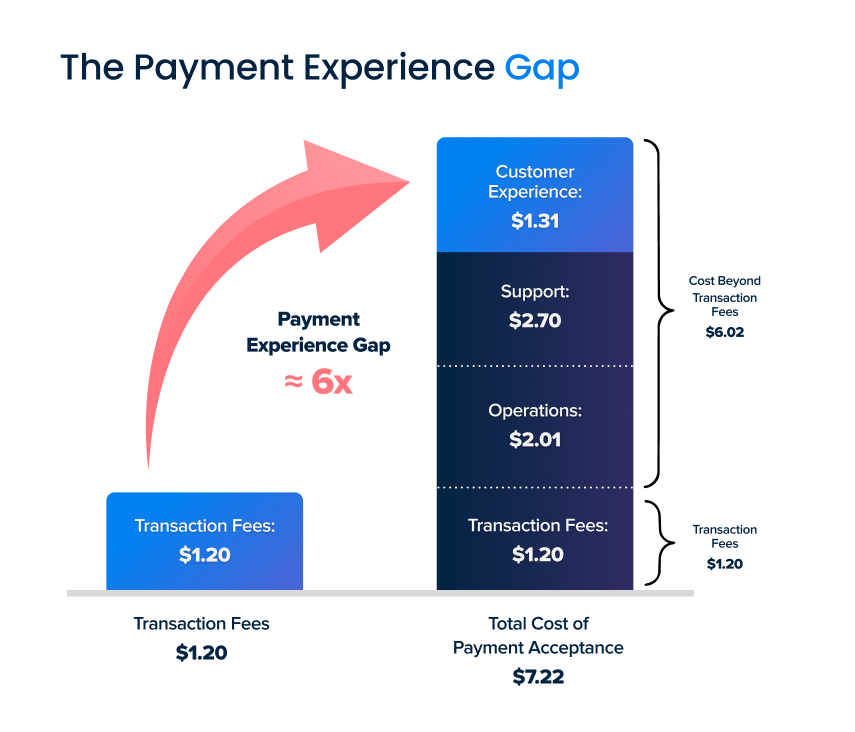
Using internal benchmarks, conservatively modeled assumptions and third-party validation, this report finds that a typical mid-size lender incurs approximately $7.22 in total cost per payment, including $1.20 in transaction fees and $6.02 in additional costs beyond processing.
These costs are expressed on a per-payment basis and represent an average across all payments, including those that complete successfully and those that require additional effort.
The difference between these figures represents the Payment Experience Gap. In total, the cost of accepting payments is six times higher than what is typically measured.
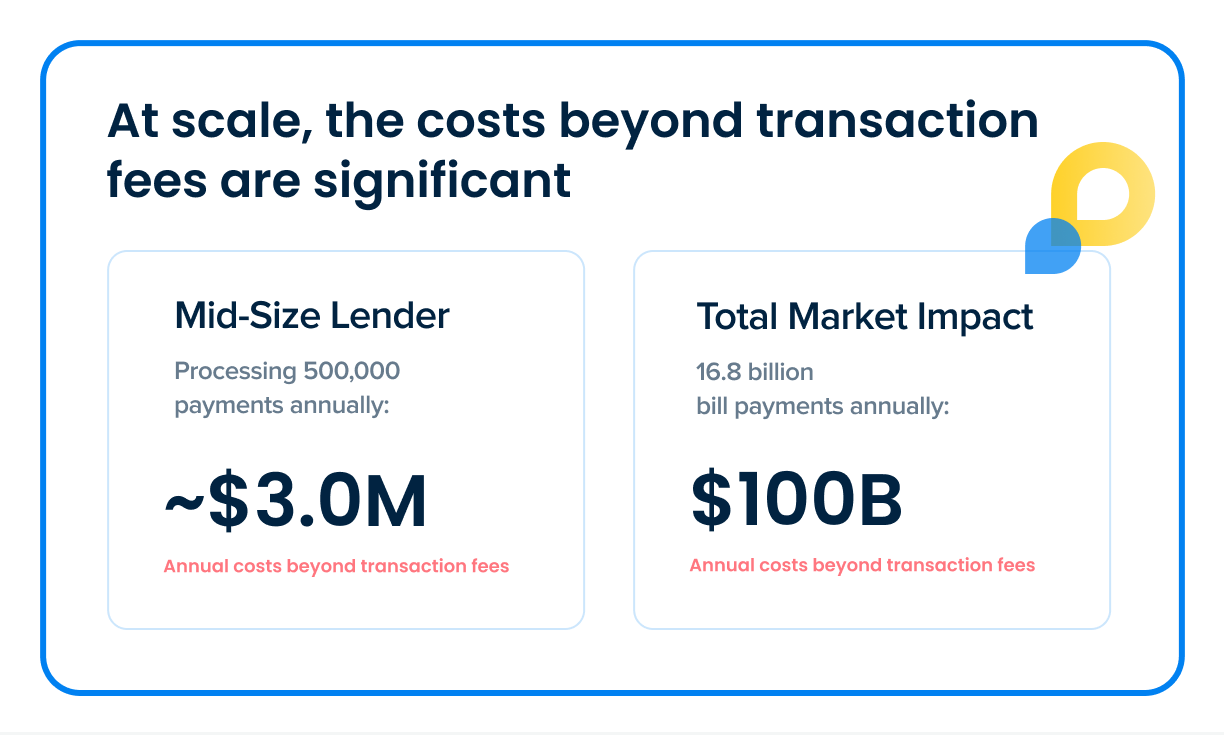
Applying this model across 16.8 billion bill payments annually within the U.S. bill-pay market, the Payment Experience Gap represents more than $100 billion in payment acceptance costs beyond transaction fees.
For an enterprise processing 500,000 payments annually, this equates to approximately $3 million in payment-related costs.
These costs rarely appear on a processor invoice, yet they represent more than 80% of the total cost of payment acceptance.
The truth about transaction fees
Transaction fees capture only a single moment—when a payment is successfully processed. Getting paid, however, is a process that spans the entire payment journey.
Before completing payments, customers must navigate the entire payment experience, which includes selecting a payment method and successfully completing the transaction. After a payment is made, organizations must validate and reconcile it while also managing payment failures, exceptions and disputes. Each step introduces friction and cost.
Quantifying the gap
Calculating the Payment Experience Gap is straightforward. It represents the difference between visible costs—transaction fees paid to processors—and the actual total cost once you account for the operational, support and experience-related effort required to get paid.
To quantify this, this report evaluates costs across three core categories:
- Customer Experience: The financial impact of delayed or incomplete payments
- Support: The cost of helping customers complete payments
- Operations: The cost of processing, recovering and reconciling payments
For each pillar, the analysis includes three steps:
- Estimate how frequently cost-driving events occur
- Apply representative cost assumptions
- Normalize results on a per-payment basis
These elements are aggregated to produce a per-payment cost estimate. The analysis focuses on the most common and repeatable drivers of payment friction, rather than attempting to capture every possible edge case.
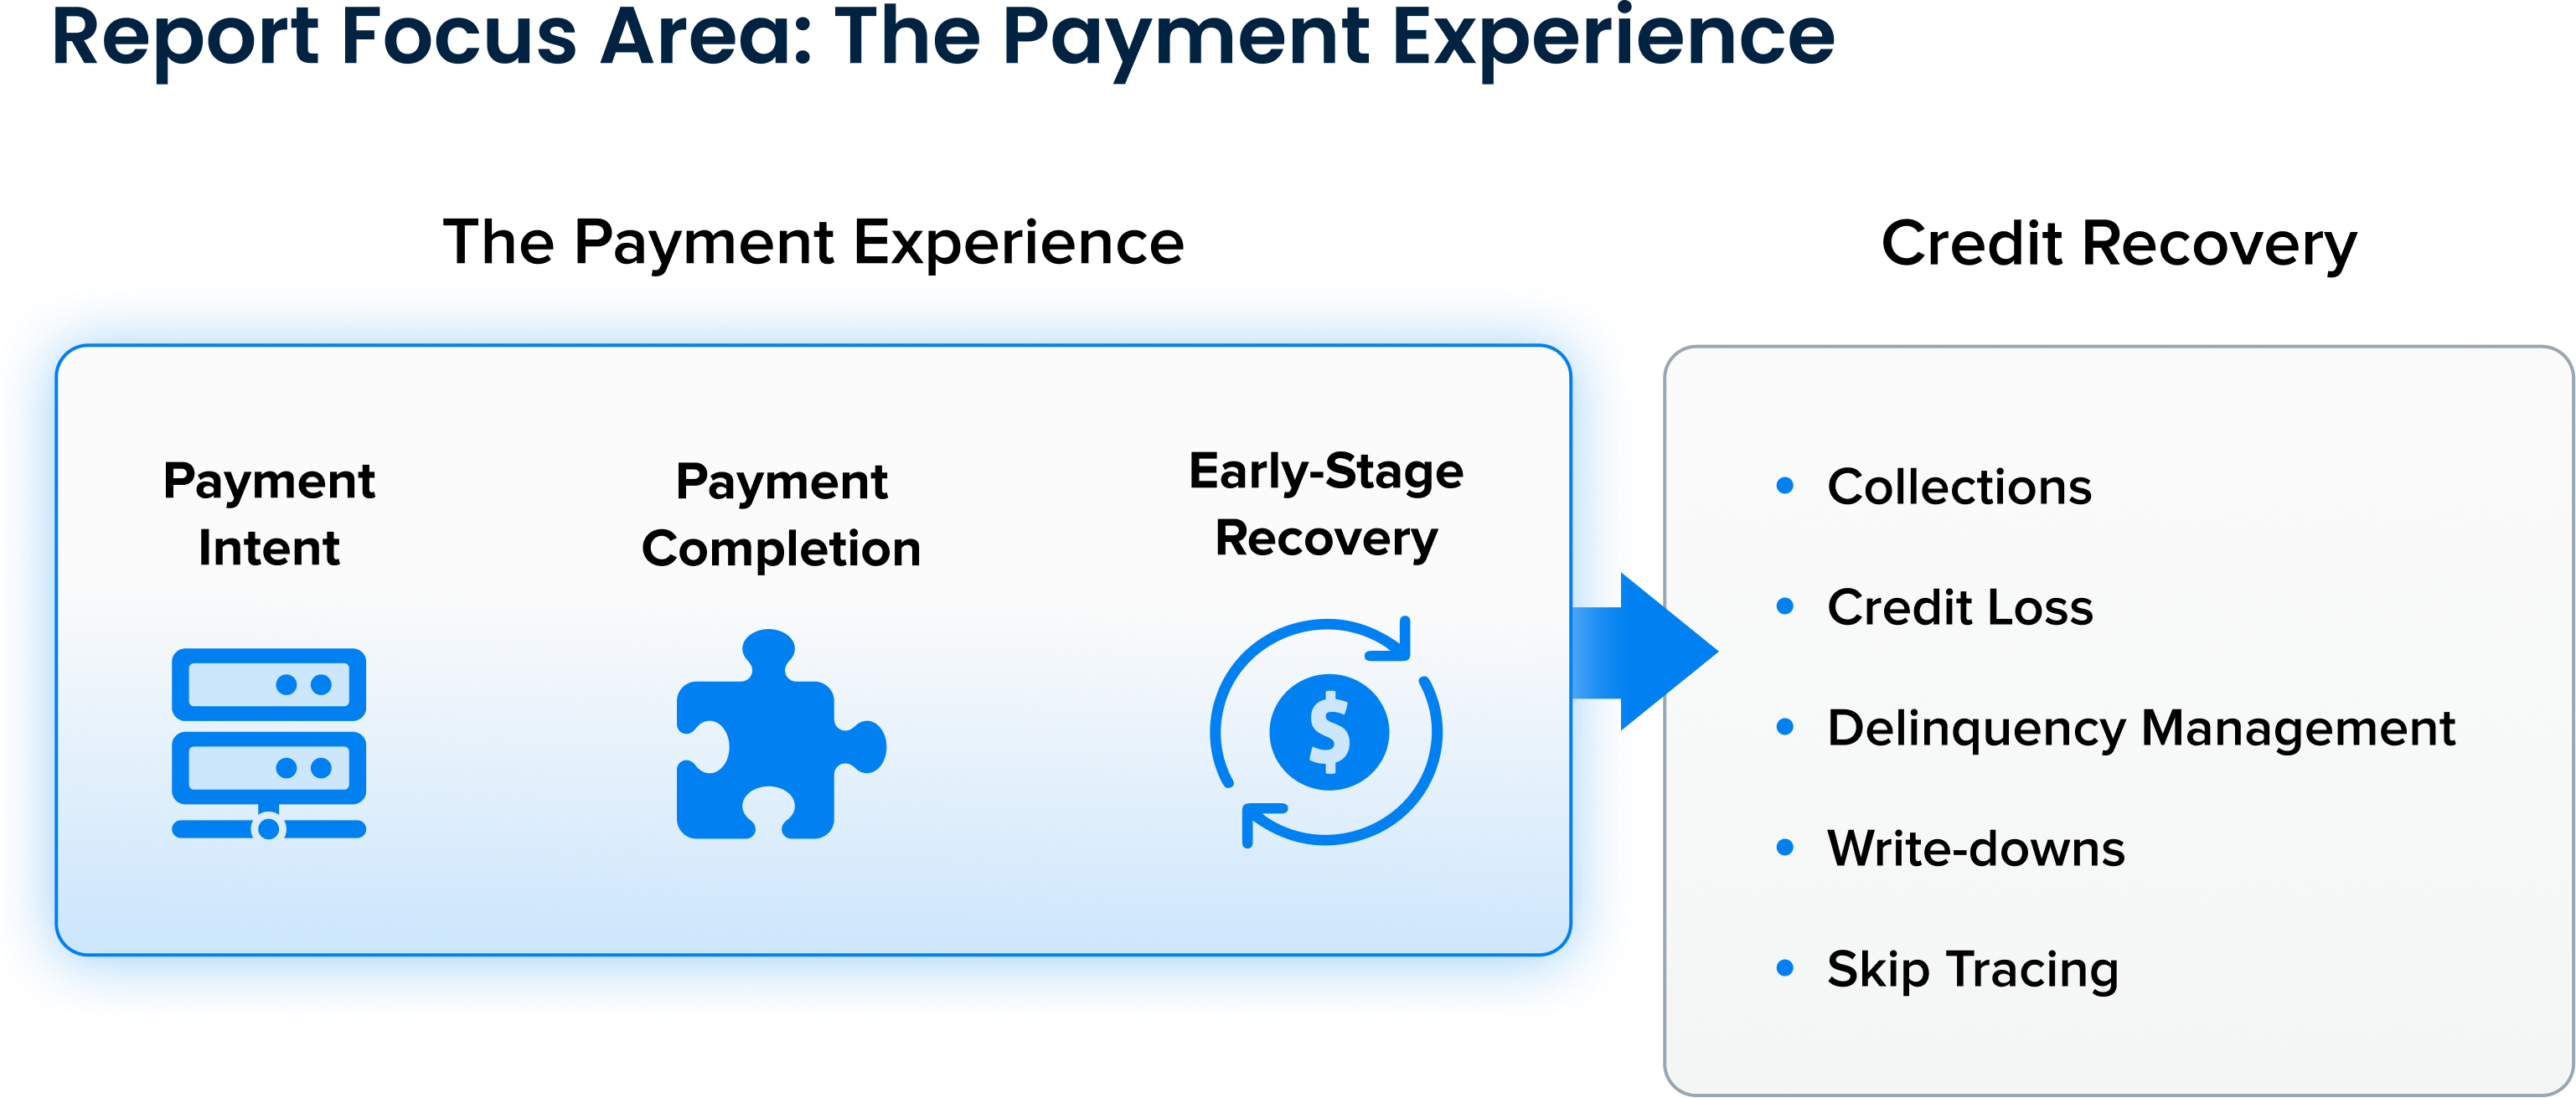
Importantly, the Payment Experience Gap is designed to quantify the costs associated with the payment experience itself—from payment intent through payment completion and early-stage recovery activity. While downstream collections, credit loss and delinquency management can create additional financial impact, those activities fall outside the scope of this analysis. As a result, the findings provide a practical view of the costs created by payment friction and the broader impact of the payment experience on payment acceptance.
The result is conservative, but directionally startling.
Transaction fees: The cost most organizations measure
Transaction fees are the direct costs organizations incur to process payments. They are widely understood, commonly measured and clearly visible in financial reporting and on processor invoices. Because these fees are easy to track, they are often treated as the primary—and sometimes only—cost of payment acceptance.
In reality, they represent only a fraction of the total cost of payment acceptance.
Calculating transaction fees
To establish a representative benchmark, this report uses a blended transaction fee derived from representative payment behavior observed across lending portfolios. Percentages reflect the share of total transactions by payment type, providing a volume-weighted view of payment activity. Wallets include PayPal, Venmo and Cash App Pay. Each payment type carries a different cost structure.
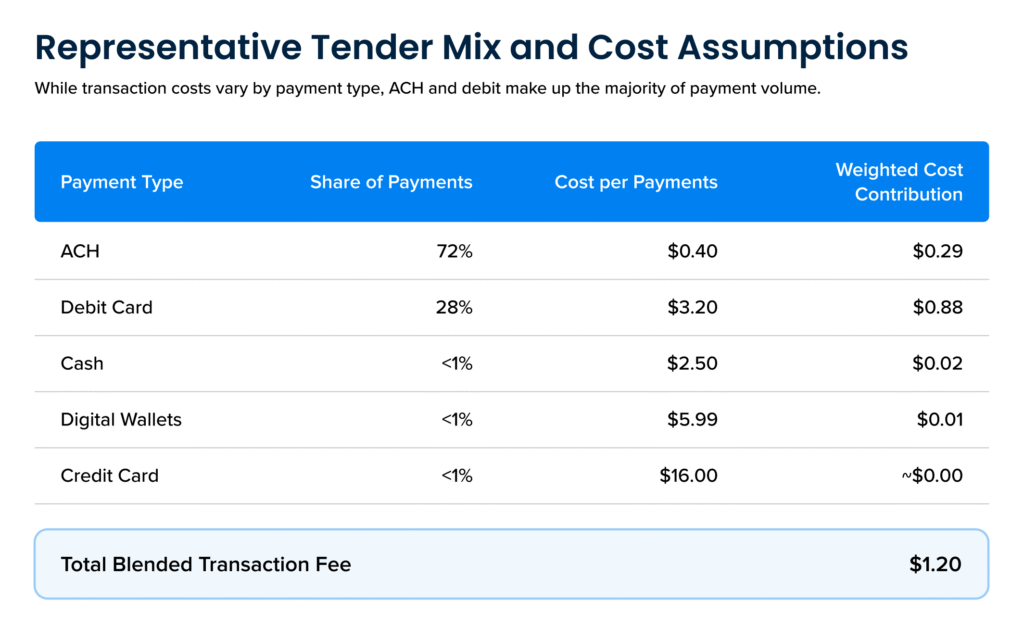
As a result, the blended transaction fee is primarily driven by ACH and debit payments. While credit cards and digital wallets carry higher fees, they represent a small share of volume.
Using these assumptions and a representative $640 payment, the blended transaction fee is approximately $1.20 per payment.
Customer experience: The financial impact of payment friction
Customer experience costs reflect the downstream financial impact created when payments are abandoned and ultimately delayed beyond the time of intent. When payment experiences are unclear, restrictive or difficult to use, customers may abandon payment attempts. While many of these payments are eventually completed, delays in resolution create additional servicing burden and slower cash flow, with some payments progressing into early-stage delinquency.
With this approach, Customer Experience is modeled not as another operational cost category, but as the financial consequence. The model therefore focuses on two primary impacts:
- the additional servicing effort associated with delayed or delinquent payments, and
- the economic impact of delayed payment receipt
Importantly, the model focuses on early-stage delinquency and short-term payment recovery activity, rather than downstream collections. The intent is to capture the financial impact of delayed payment completion, not collections activity.
The model assumes that approximately 20% of payments are abandoned or not completed at the time of intent. Of those abandoned payments, approximately 25% are assumed to remain unpaid by the due date or progress into early-stage delinquency.
Delayed payments also create a financial cost, as organizations must continue funding receivables while waiting for payment to be received. The model incorporates this impact using a representative payment size of $640 and a 10% cost of capital assumption.
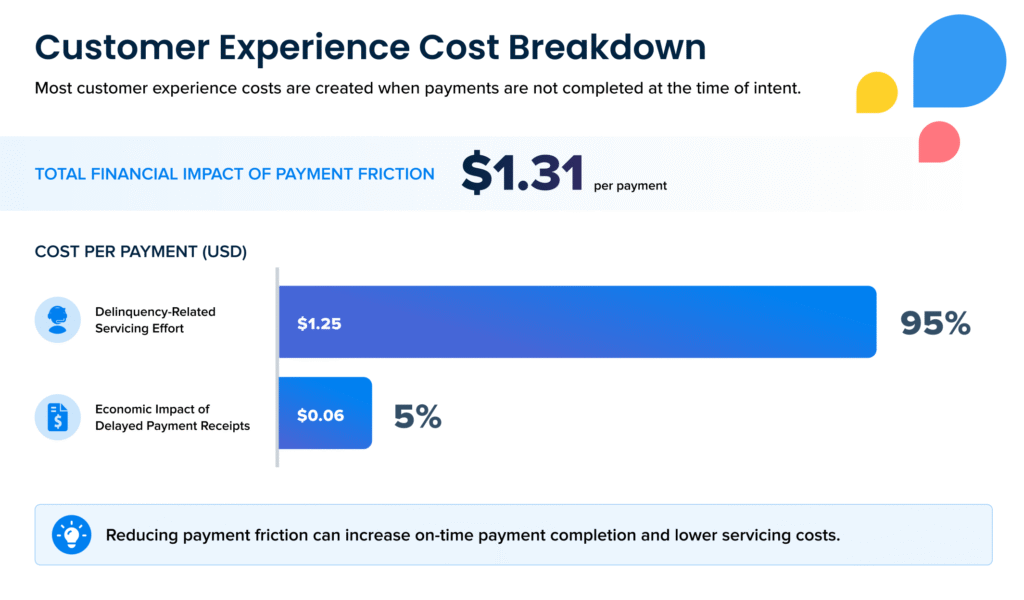
Combined, these components result in a Customer Experience cost of approximately $1.31 per payment.
Support: The cost of customer interaction
Customer support remains a persistent need in payment journeys, even as digital self-service options improve.
Customers seek help when they can’t complete payments independently due to login issues, unclear payment flows, limited payment options or general confusion. In many cases, customers are willing and able to pay, but encounter friction that prevents them from completing transactions without aid.
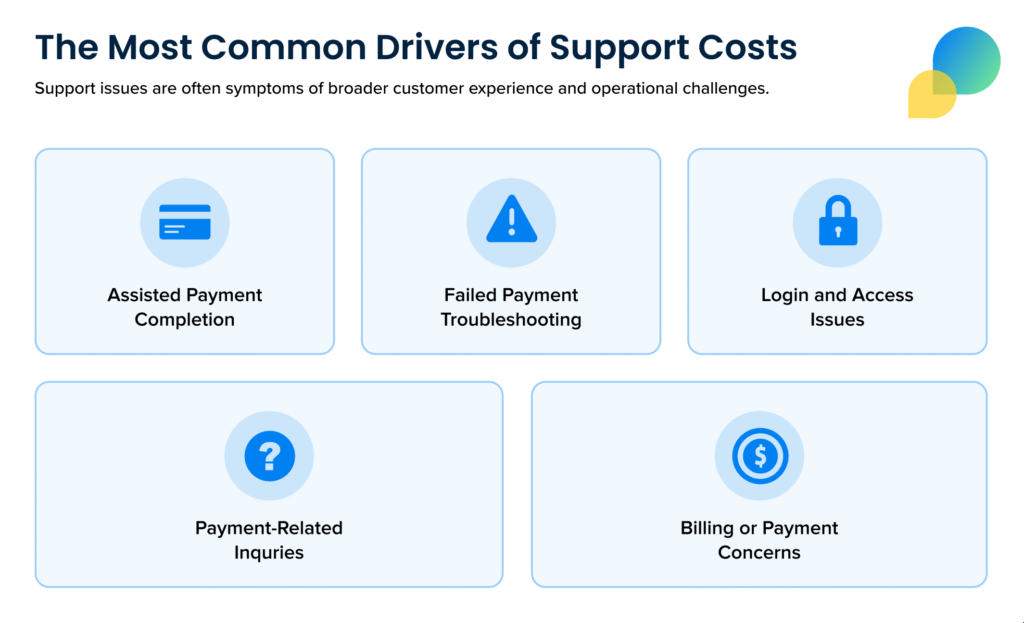
For the purposes of this report, five common support drivers are considered:
- Assisted payment completion
- Failed payment troubleshooting
- Login and access issues
- Payment-related inquiries
- Billing or payment concerns (e.g. hardship assistance)
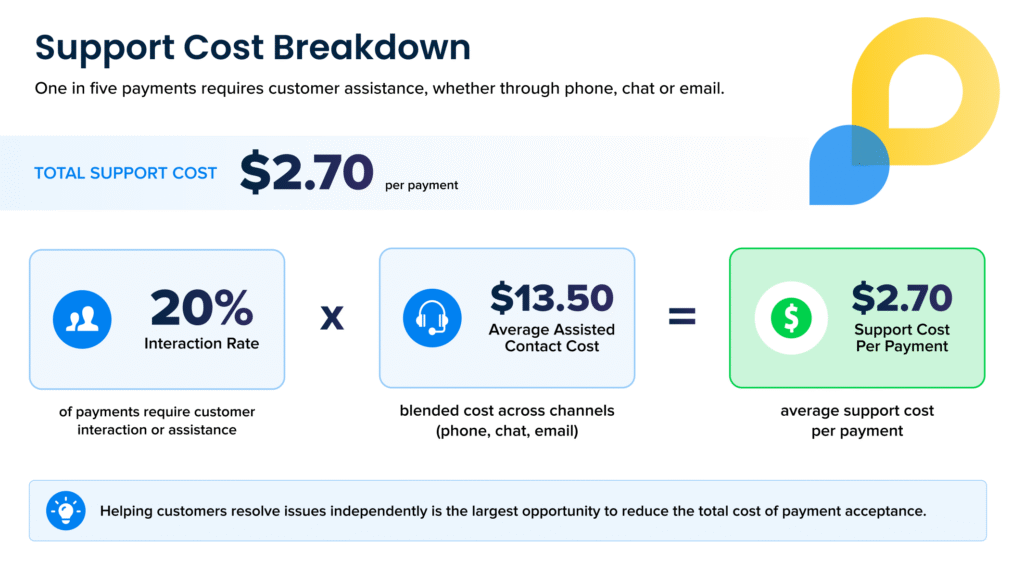
Using a representative interaction rate of approximately 20%, and Gartner benchmark data estimating a blended assisted support cost of approximately $13.50 per contact across channels such as phone, chat and email, average support costs equate to approximately $2.70 per payment.
Operations: The cost of managing payment failure
Operational costs represent the effort required to manage payments when they don’t proceed cleanly from request to reconciliation. Costs arise when payments fail, require recovery or must be reconciled through additional support.
For the purposes of this report, five primary operational cost drivers are considered:
- ACH returns and recovery: Returned bank payments and the effort required to recover them
- Chargebacks: Card-based disputes
- Check and money order processing: Processing of physical check and money order payments
- In-person payment handling: Payments accepted and processed in a physical location
- Reconciliation and back-office labor: Payment reconciliation and back-office validation and processing
The analysis incorporates representative assumptions for payment failures, recovery effort, dispute handling, manual payment processing and back-office reconciliation activity. While these costs are often distributed across multiple teams and systems, they represent a meaningful component of the total cost of payment acceptance and are directly tied to the payment journey.
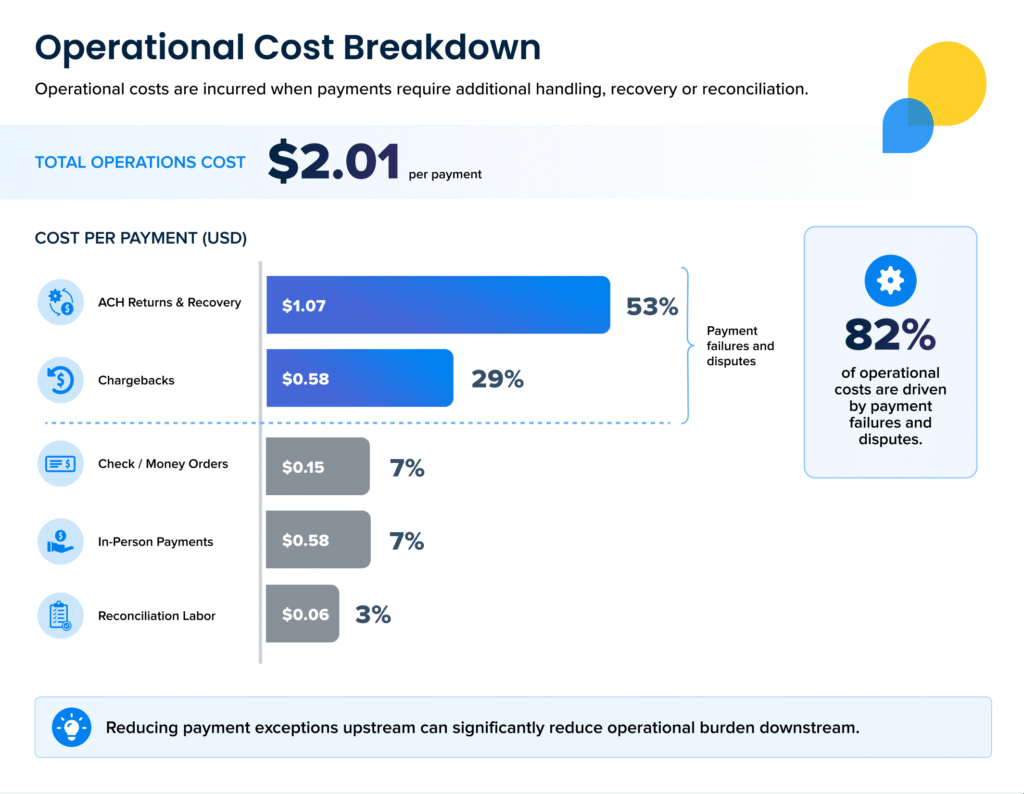
Combined, these activities result in an Operations cost of approximately $2.01 per payment.
The total cost of accepting payments
The bottom line: Transaction fees represent only a portion of what it takes to get paid. When customer interaction, incomplete payment attempts and operational effort are included, the full cost becomes significantly higher.
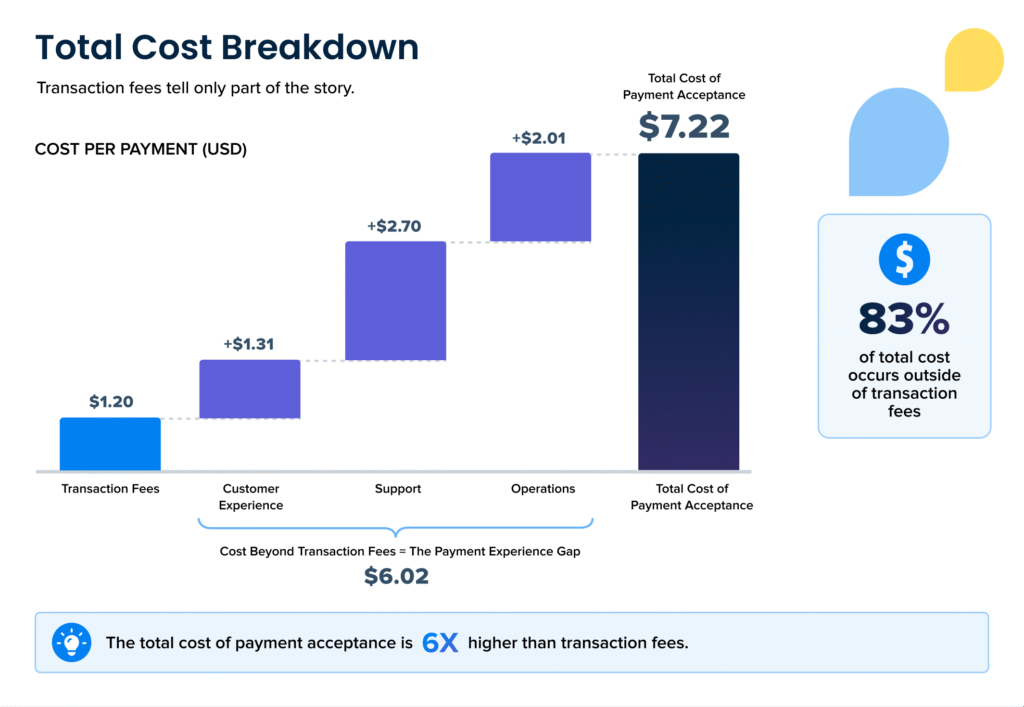
The gap is clear: For every $1.20 spent on processing a payment, an additional $6.02 is spent on everything required to complete it.
Understanding the gap
Having quantified the Payment Experience Gap, the obvious question is why it exists.
In many organizations, the payment experience is treated as a surface-level issue—something to be improved at the interface or channel level. In reality, it is a huge under-appreciated driver of financial performance. When the experience does not function effectively, the consequences appear elsewhere: in delayed or incomplete payments, increased support demand and operational workload.
The problem is compounded by limited visibility into these costs. Exceptions, retries and support-driven completion are often tracked independently, if at all. As a result, organizations often lack a complete view of the total cost of payment acceptance.
What appear as separate customer, support and operational issues are, in reality, outcomes of how the payment experience performs. Addressing the gap requires a more complete view, one that considers payments not just at the point of processing, but across the full journey.
Finding a solution: Payment Experience Management
Organizations can reduce the Payment Experience Gap by improving the payment experience: driving satisfaction, accelerating payments and reducing the total cost of acceptance.
This requires a shift from optimizing individual transactions to managing the full end-to-end payment journey. Payment Experience Management (PEM) represents this shift: the discipline of owning and continuously improving how payments are completed across the entire journey.
Improvement opportunities fall into three areas.
1. Improve customer experience
There are multiple steps companies can take to reduce friction at the point of payment:
- Provide a broad range of payment options, including modern methods like digital wallets
- Simplify payment flows and improve usability
- Personalize payment options based on customer preferences
- Use reminders and notifications to reduce missed or delayed payments
2. Increase self-service resolution
Other measures can make it easier for customers to resolve issues independently:
- Improve self-service capabilities for login and account access issues
- Keep customers within the self-service channel to resolve payment issues
- Provide clearer payment instructions and error handling
- Reduce confusion in payment flows and account management
3. Optimize operational performance
Additional steps can improve payment processing and reduce exceptions and failures:
- Automate ACH retry strategies to improve recovery rates
- Apply business rules to reduce manual intervention
- Build redundancy into processing systems to reduce downtime
- Improve dispute handling to minimize chargeback-related losses
- Leverage data and automation to reduce fraud risk
Closing the Payment Experience Gap
The Payment Experience Gap is not simply a cost issue. It reflects how the payment experience performs across the entire journey—from request to reconciliation. The costs quantified in this report are not isolated. They are the result of friction, breakdowns and inefficiencies across that journey.
Improving the payment experience does more than reduce cost. It changes how the system works. More payments are completed at the time of intent. Fewer interactions are required. Less effort is spent resolving exceptions and recovering payments that did not complete as expected.
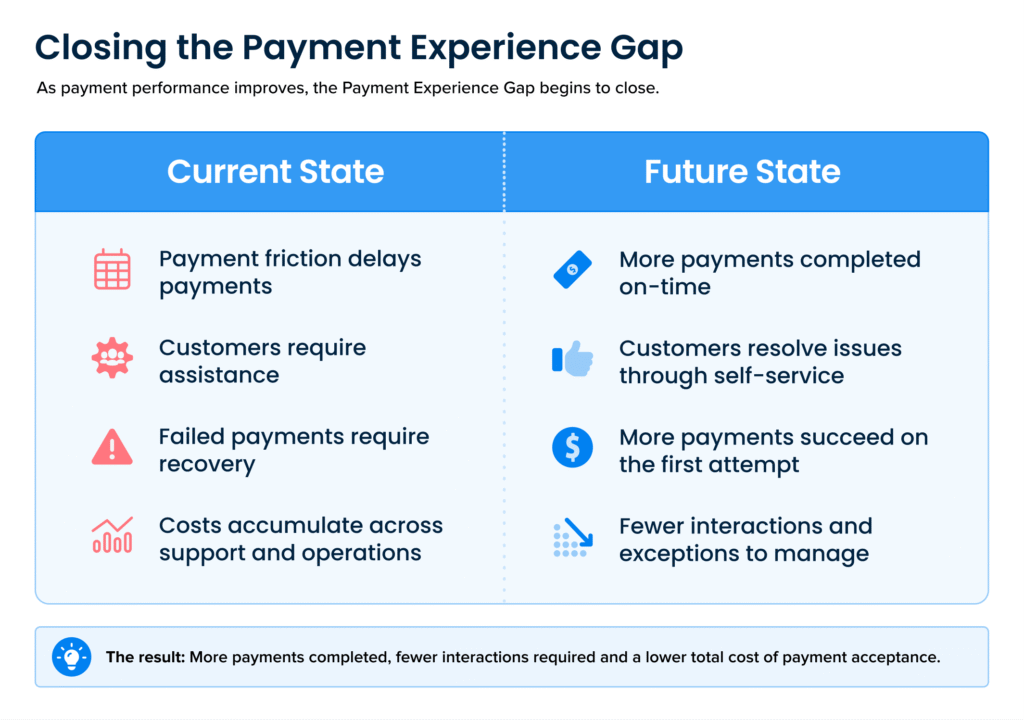
As the experience improves, the costs outlined in this report begin to diminish, resulting in a more efficient, more predictable, and ultimately less costly path to payment acceptance.