Research Stats & Charts
Want to use these stats in your own publications? Download the images below, or reach out to insights@paynearme.com to gain access to more in-depth research.
The Impact of Payment Experience on Toll Revenue Leakage
This report explores how payment challenges in the tolling industry impact U.S. drivers and agencies alike.
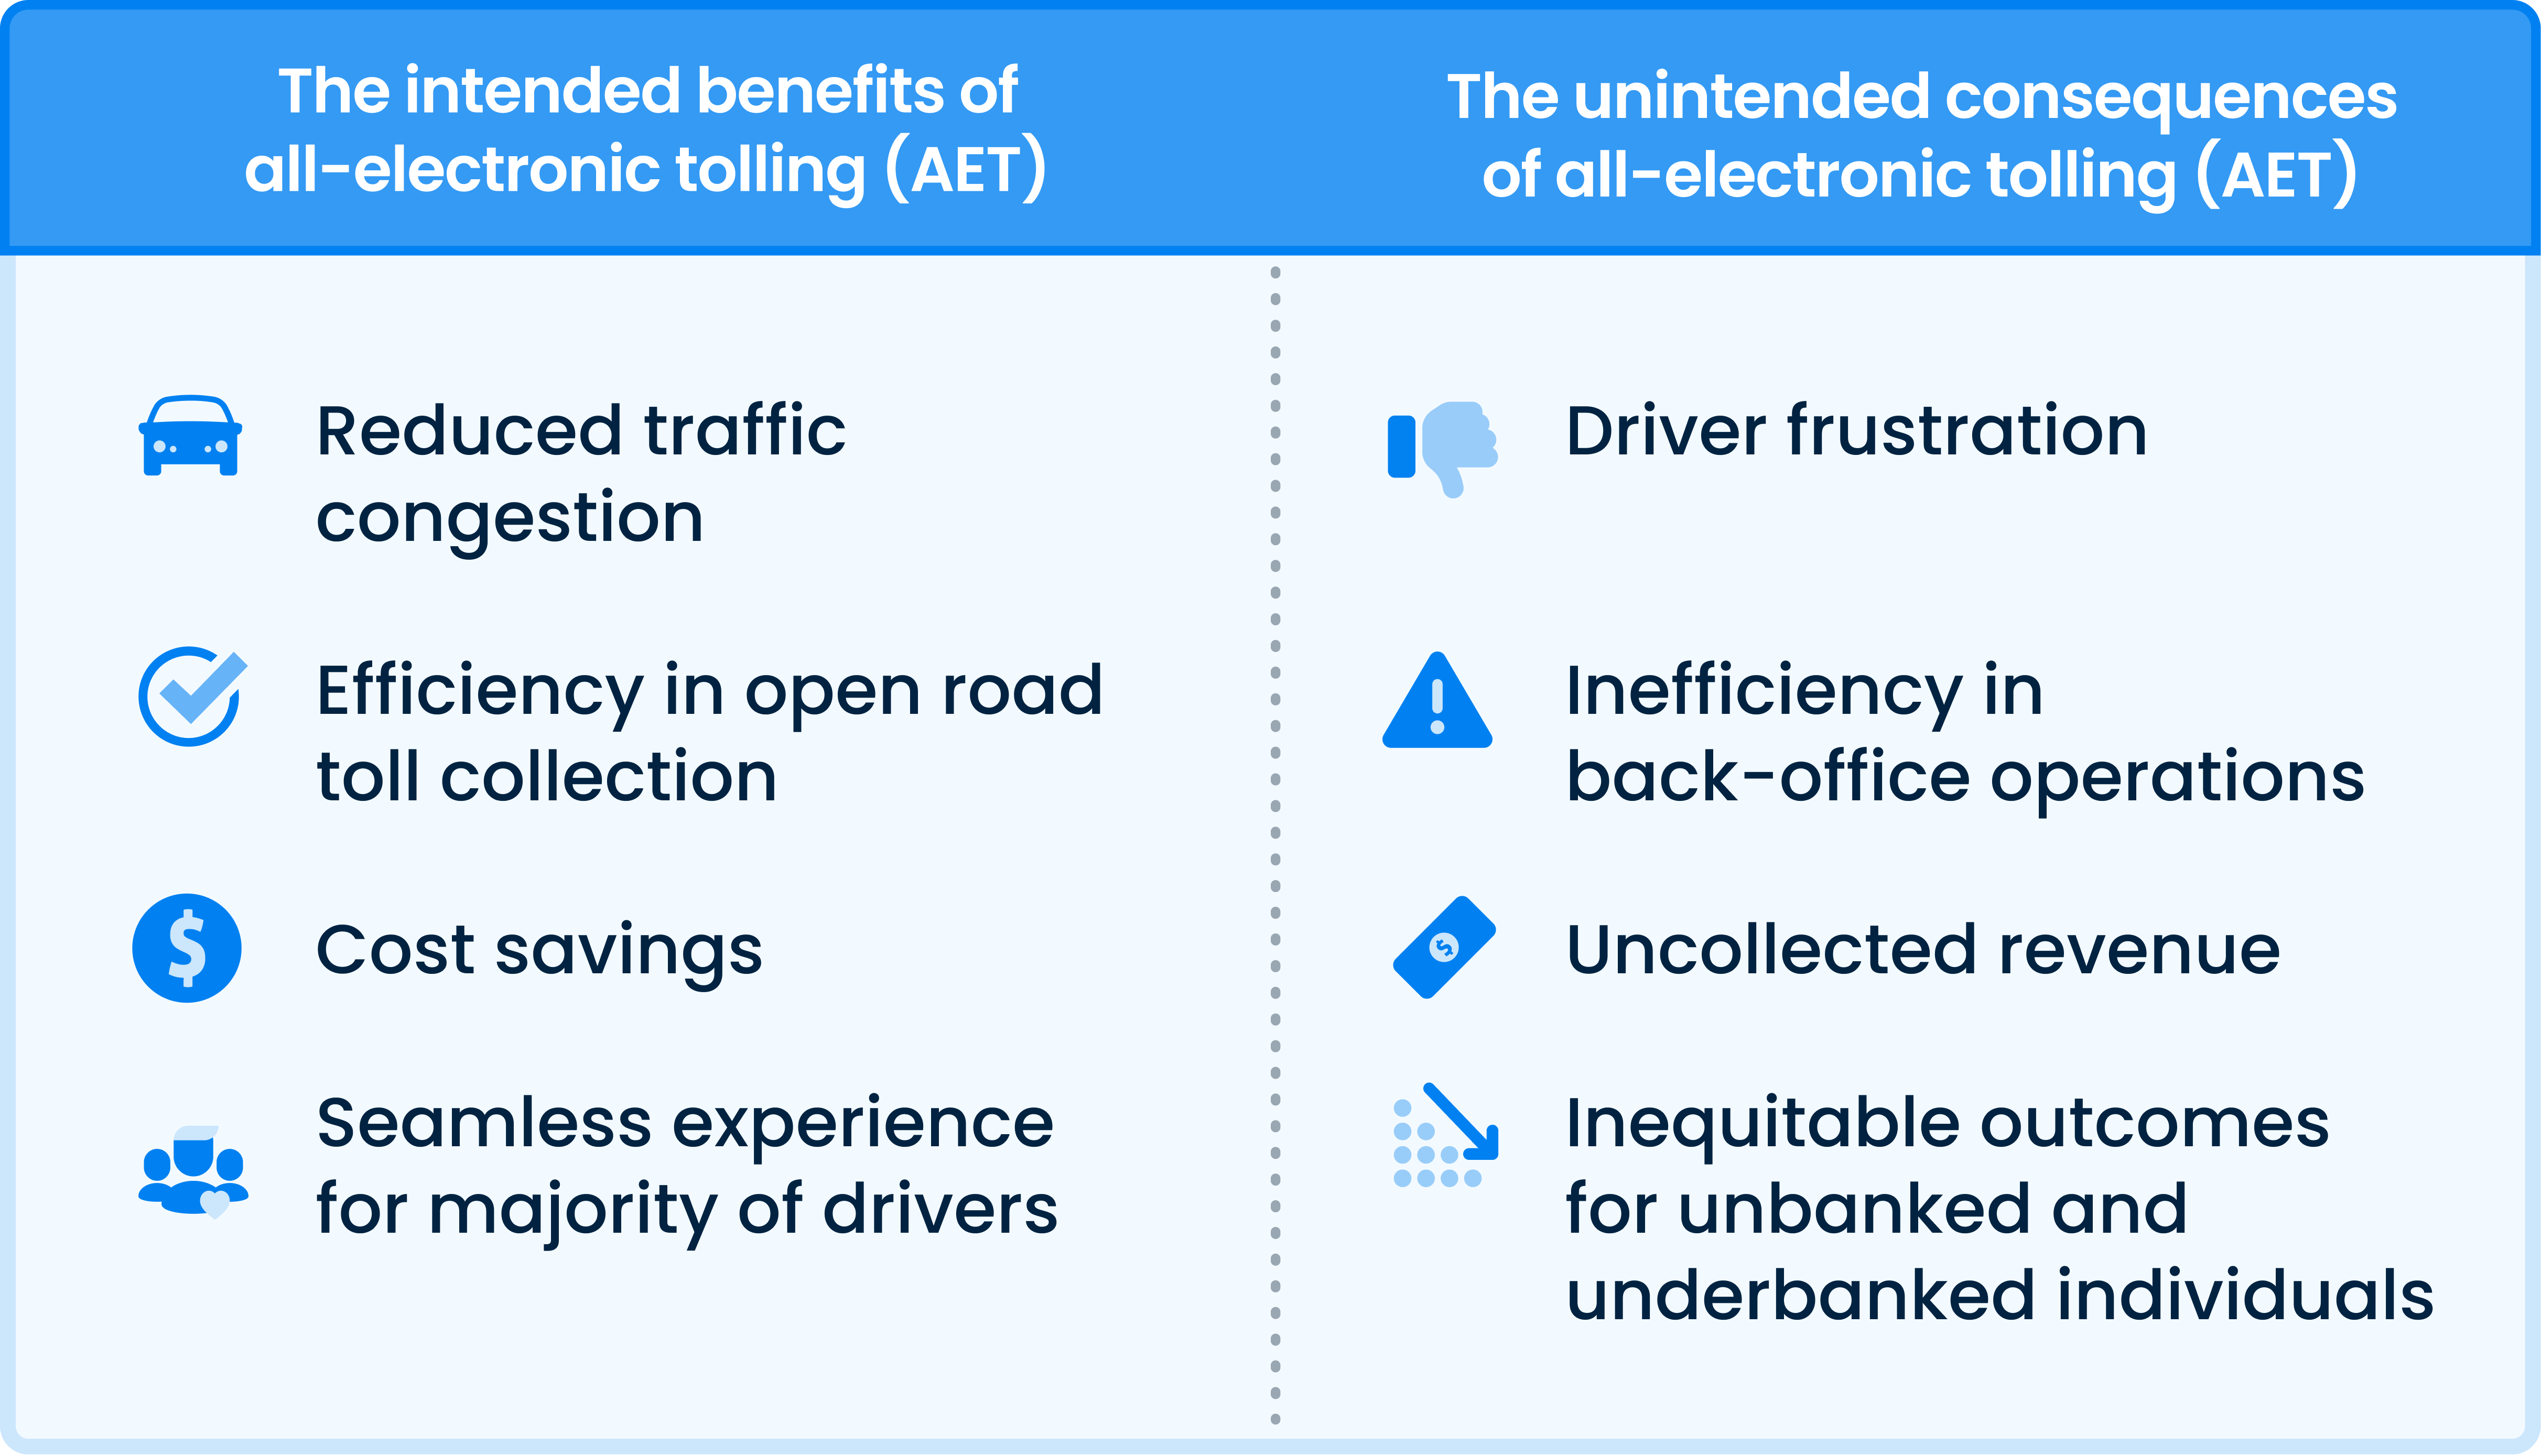 Unintended consequences of AET
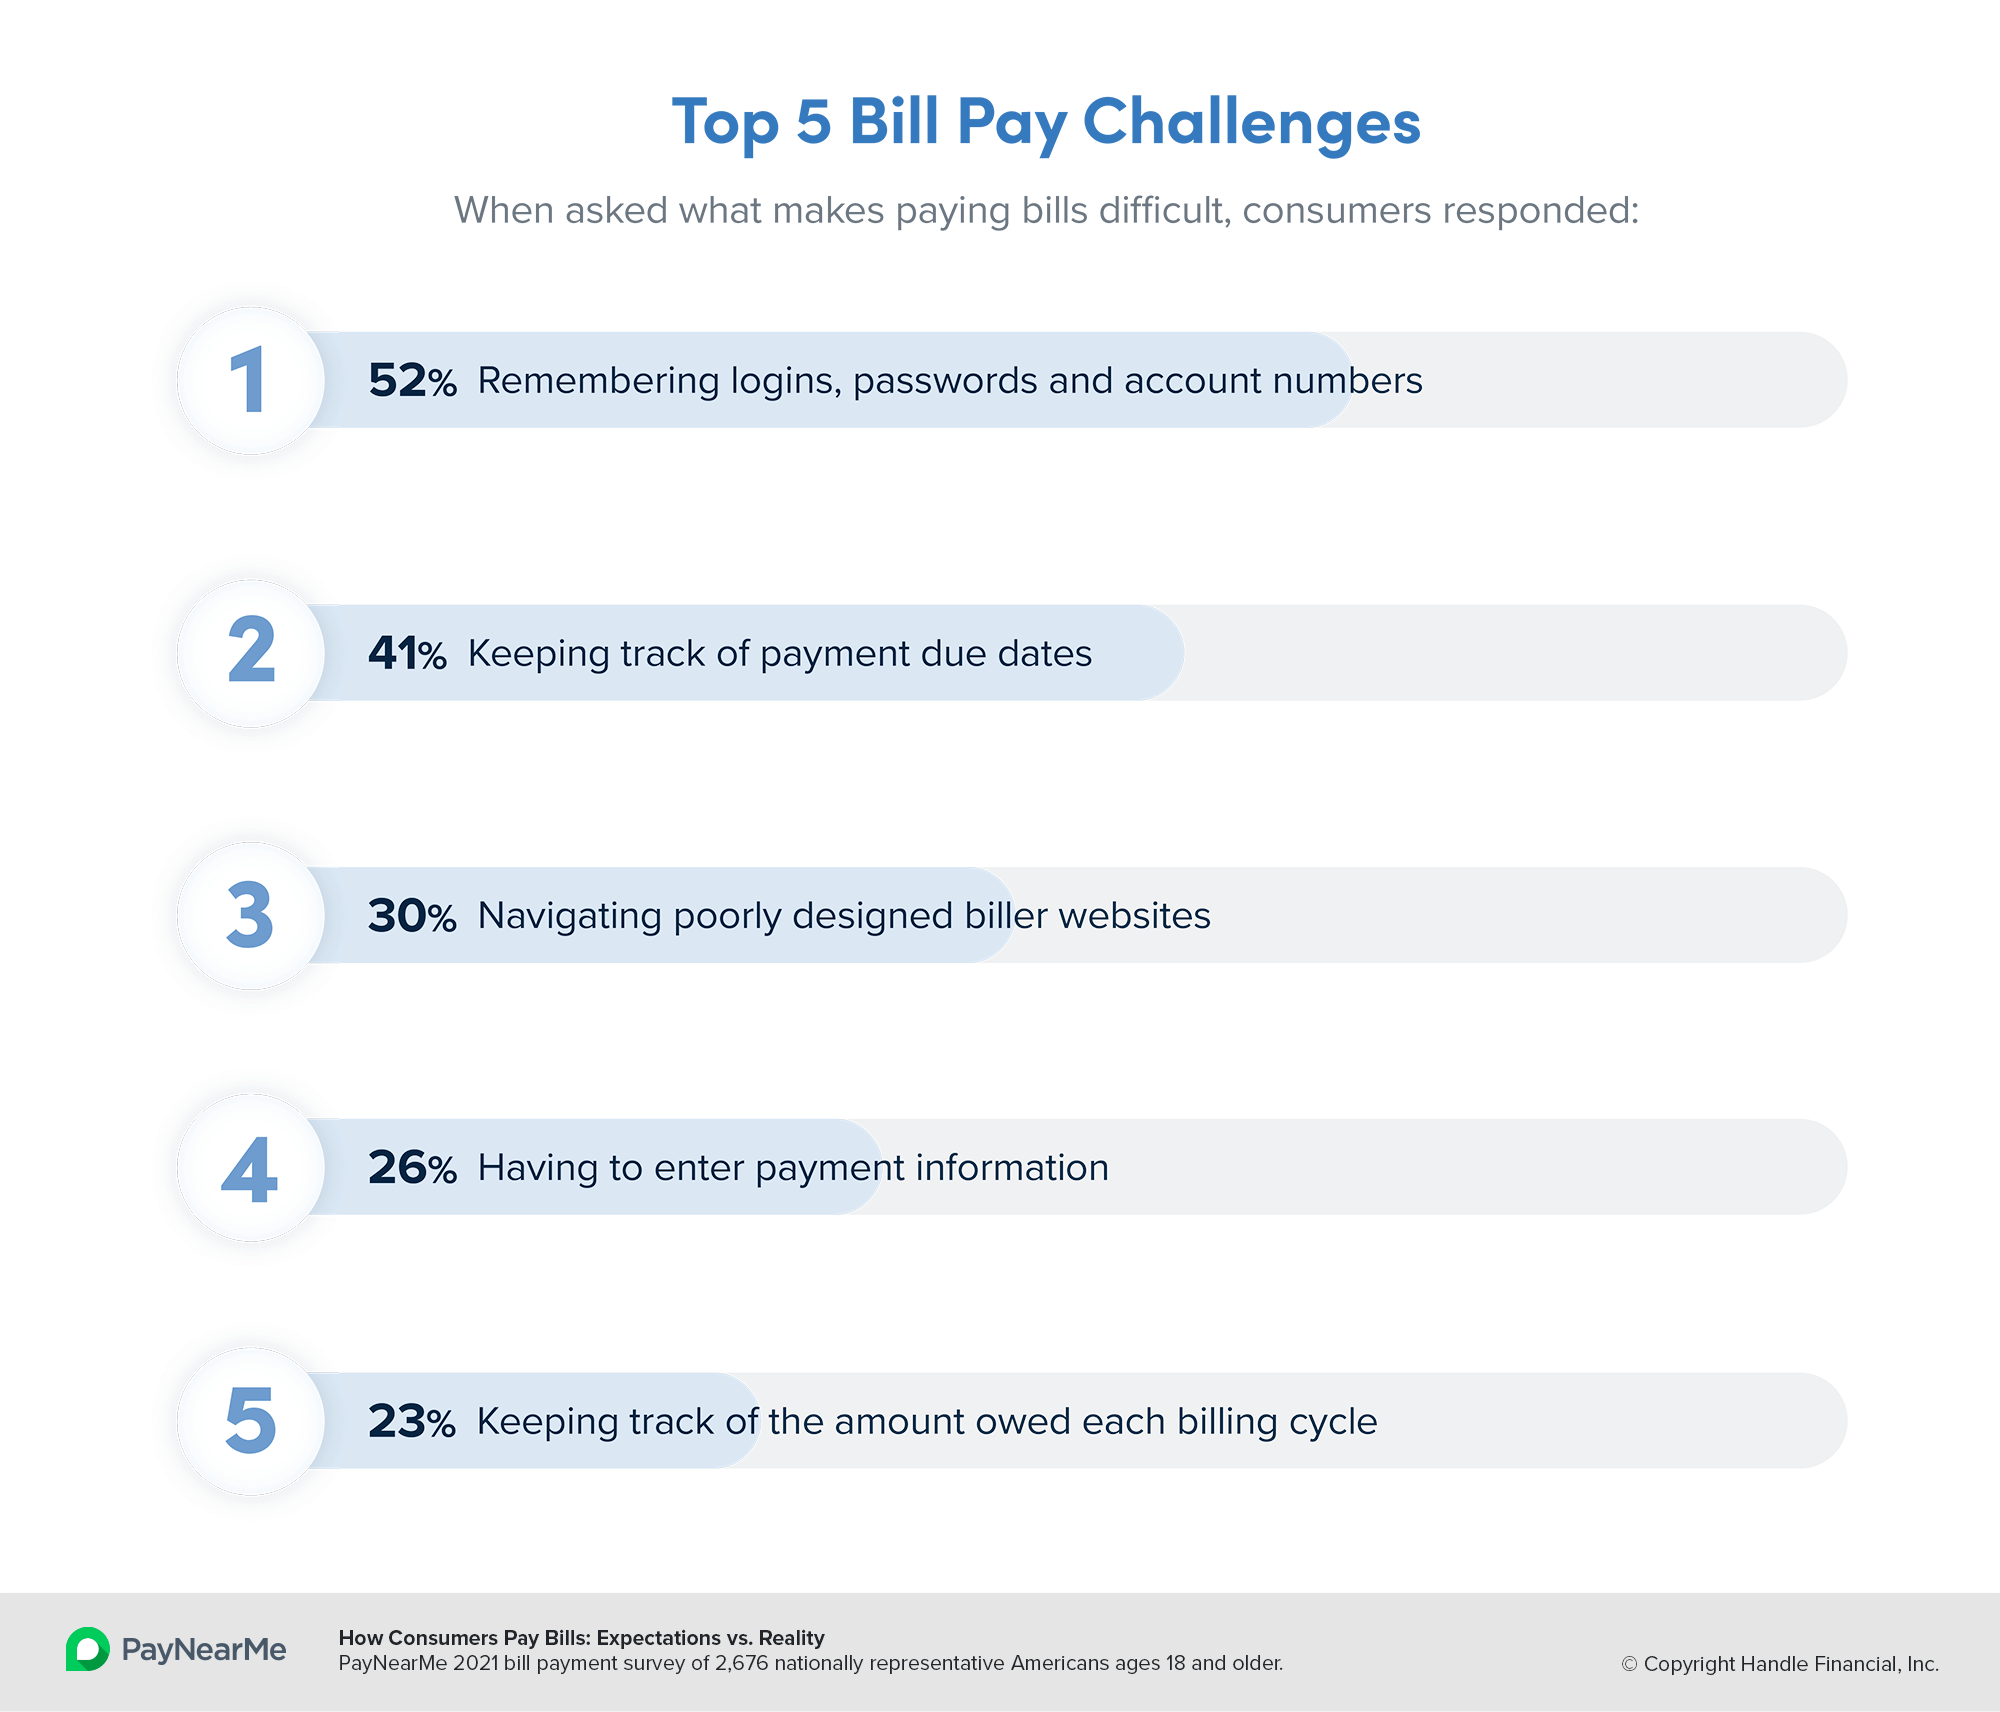
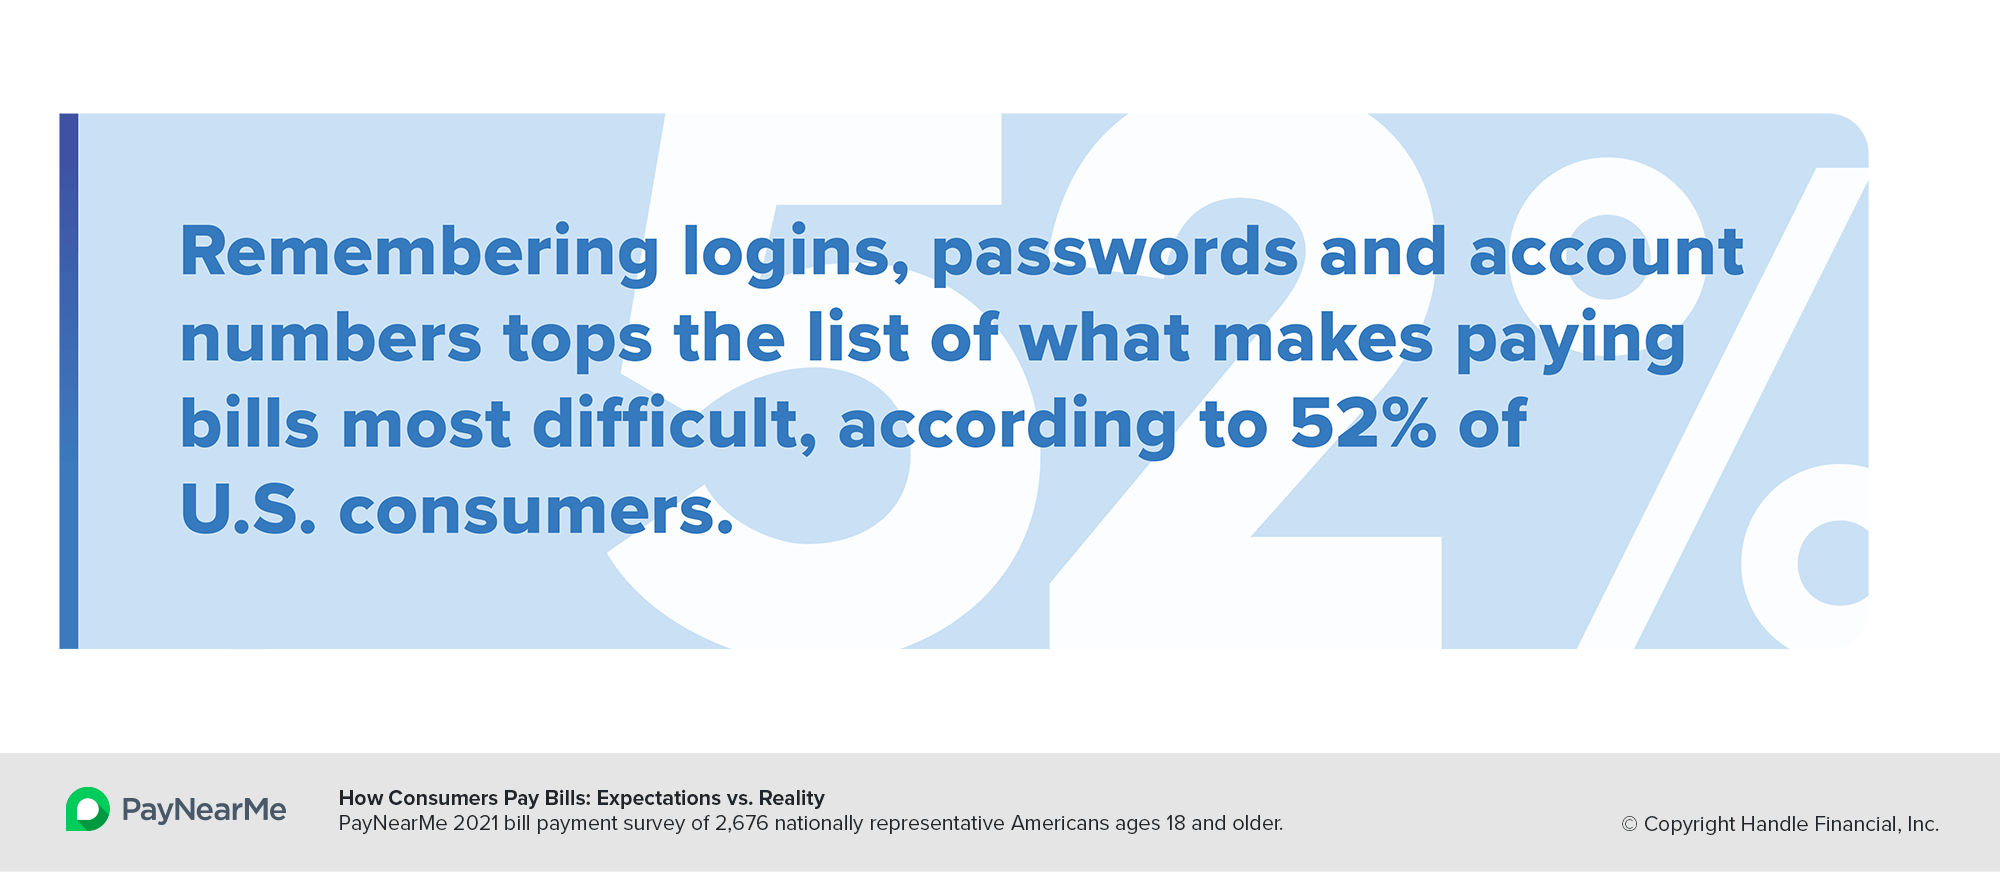
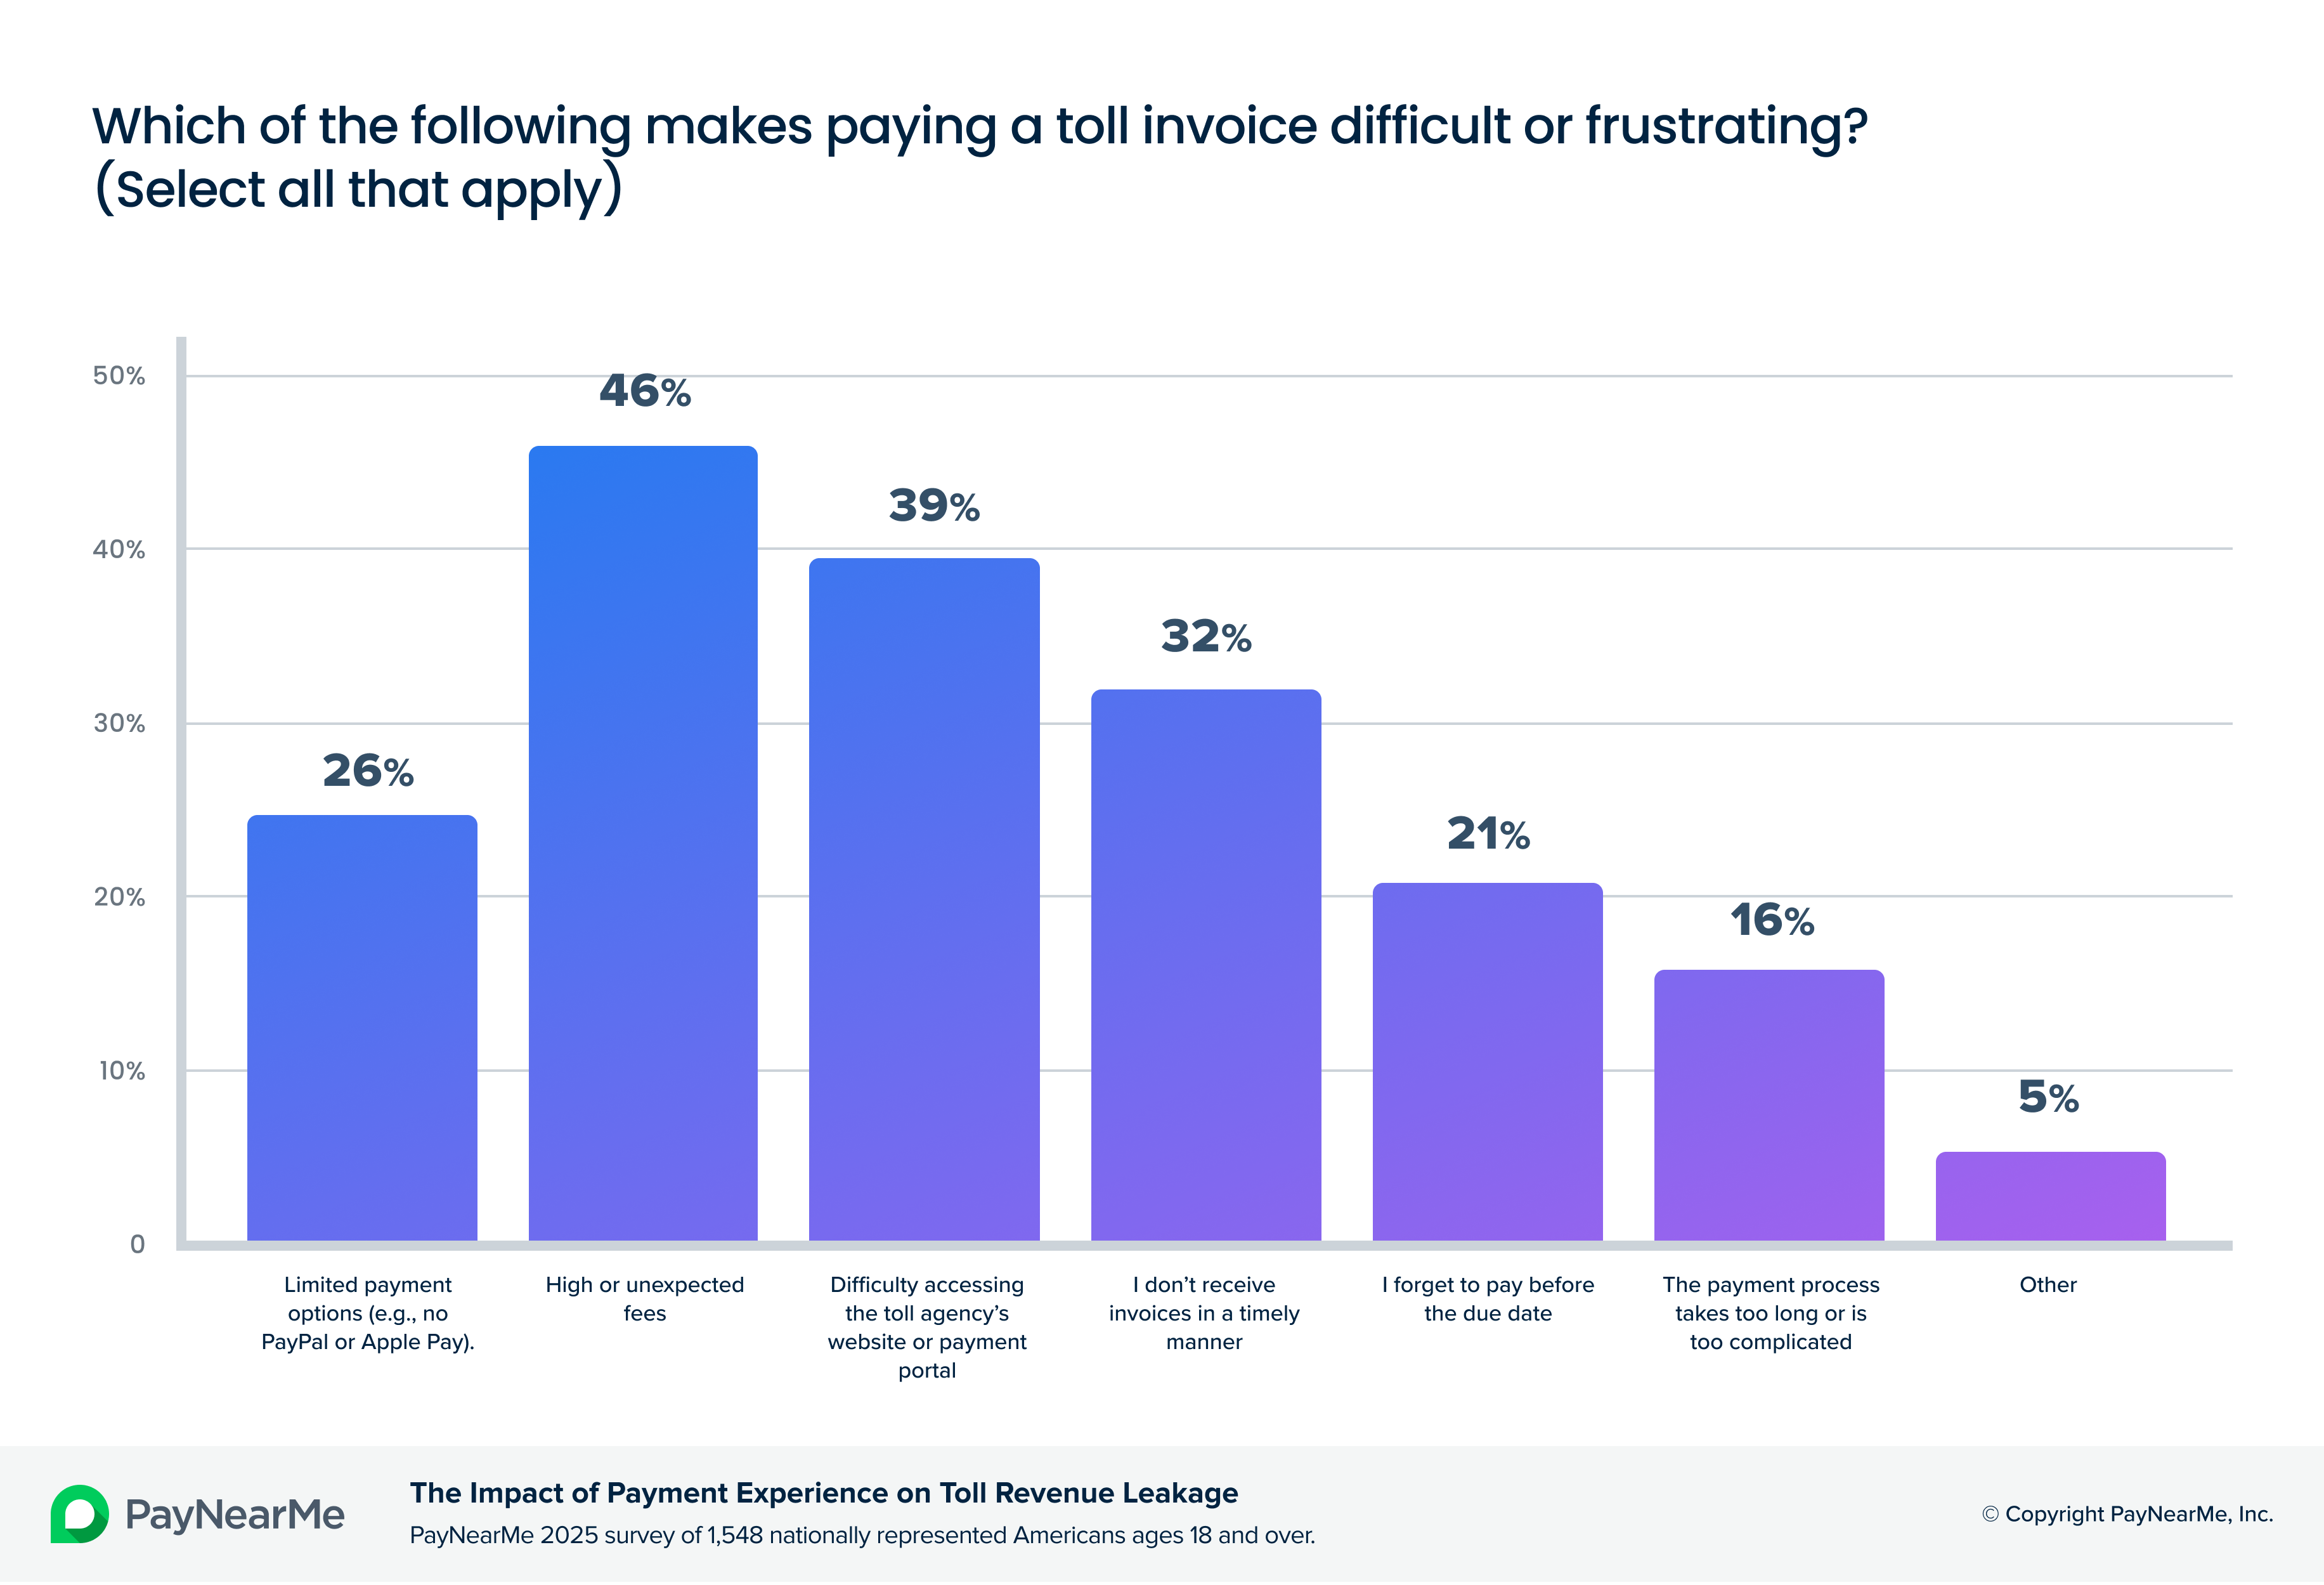 What makes paying invoices difficult
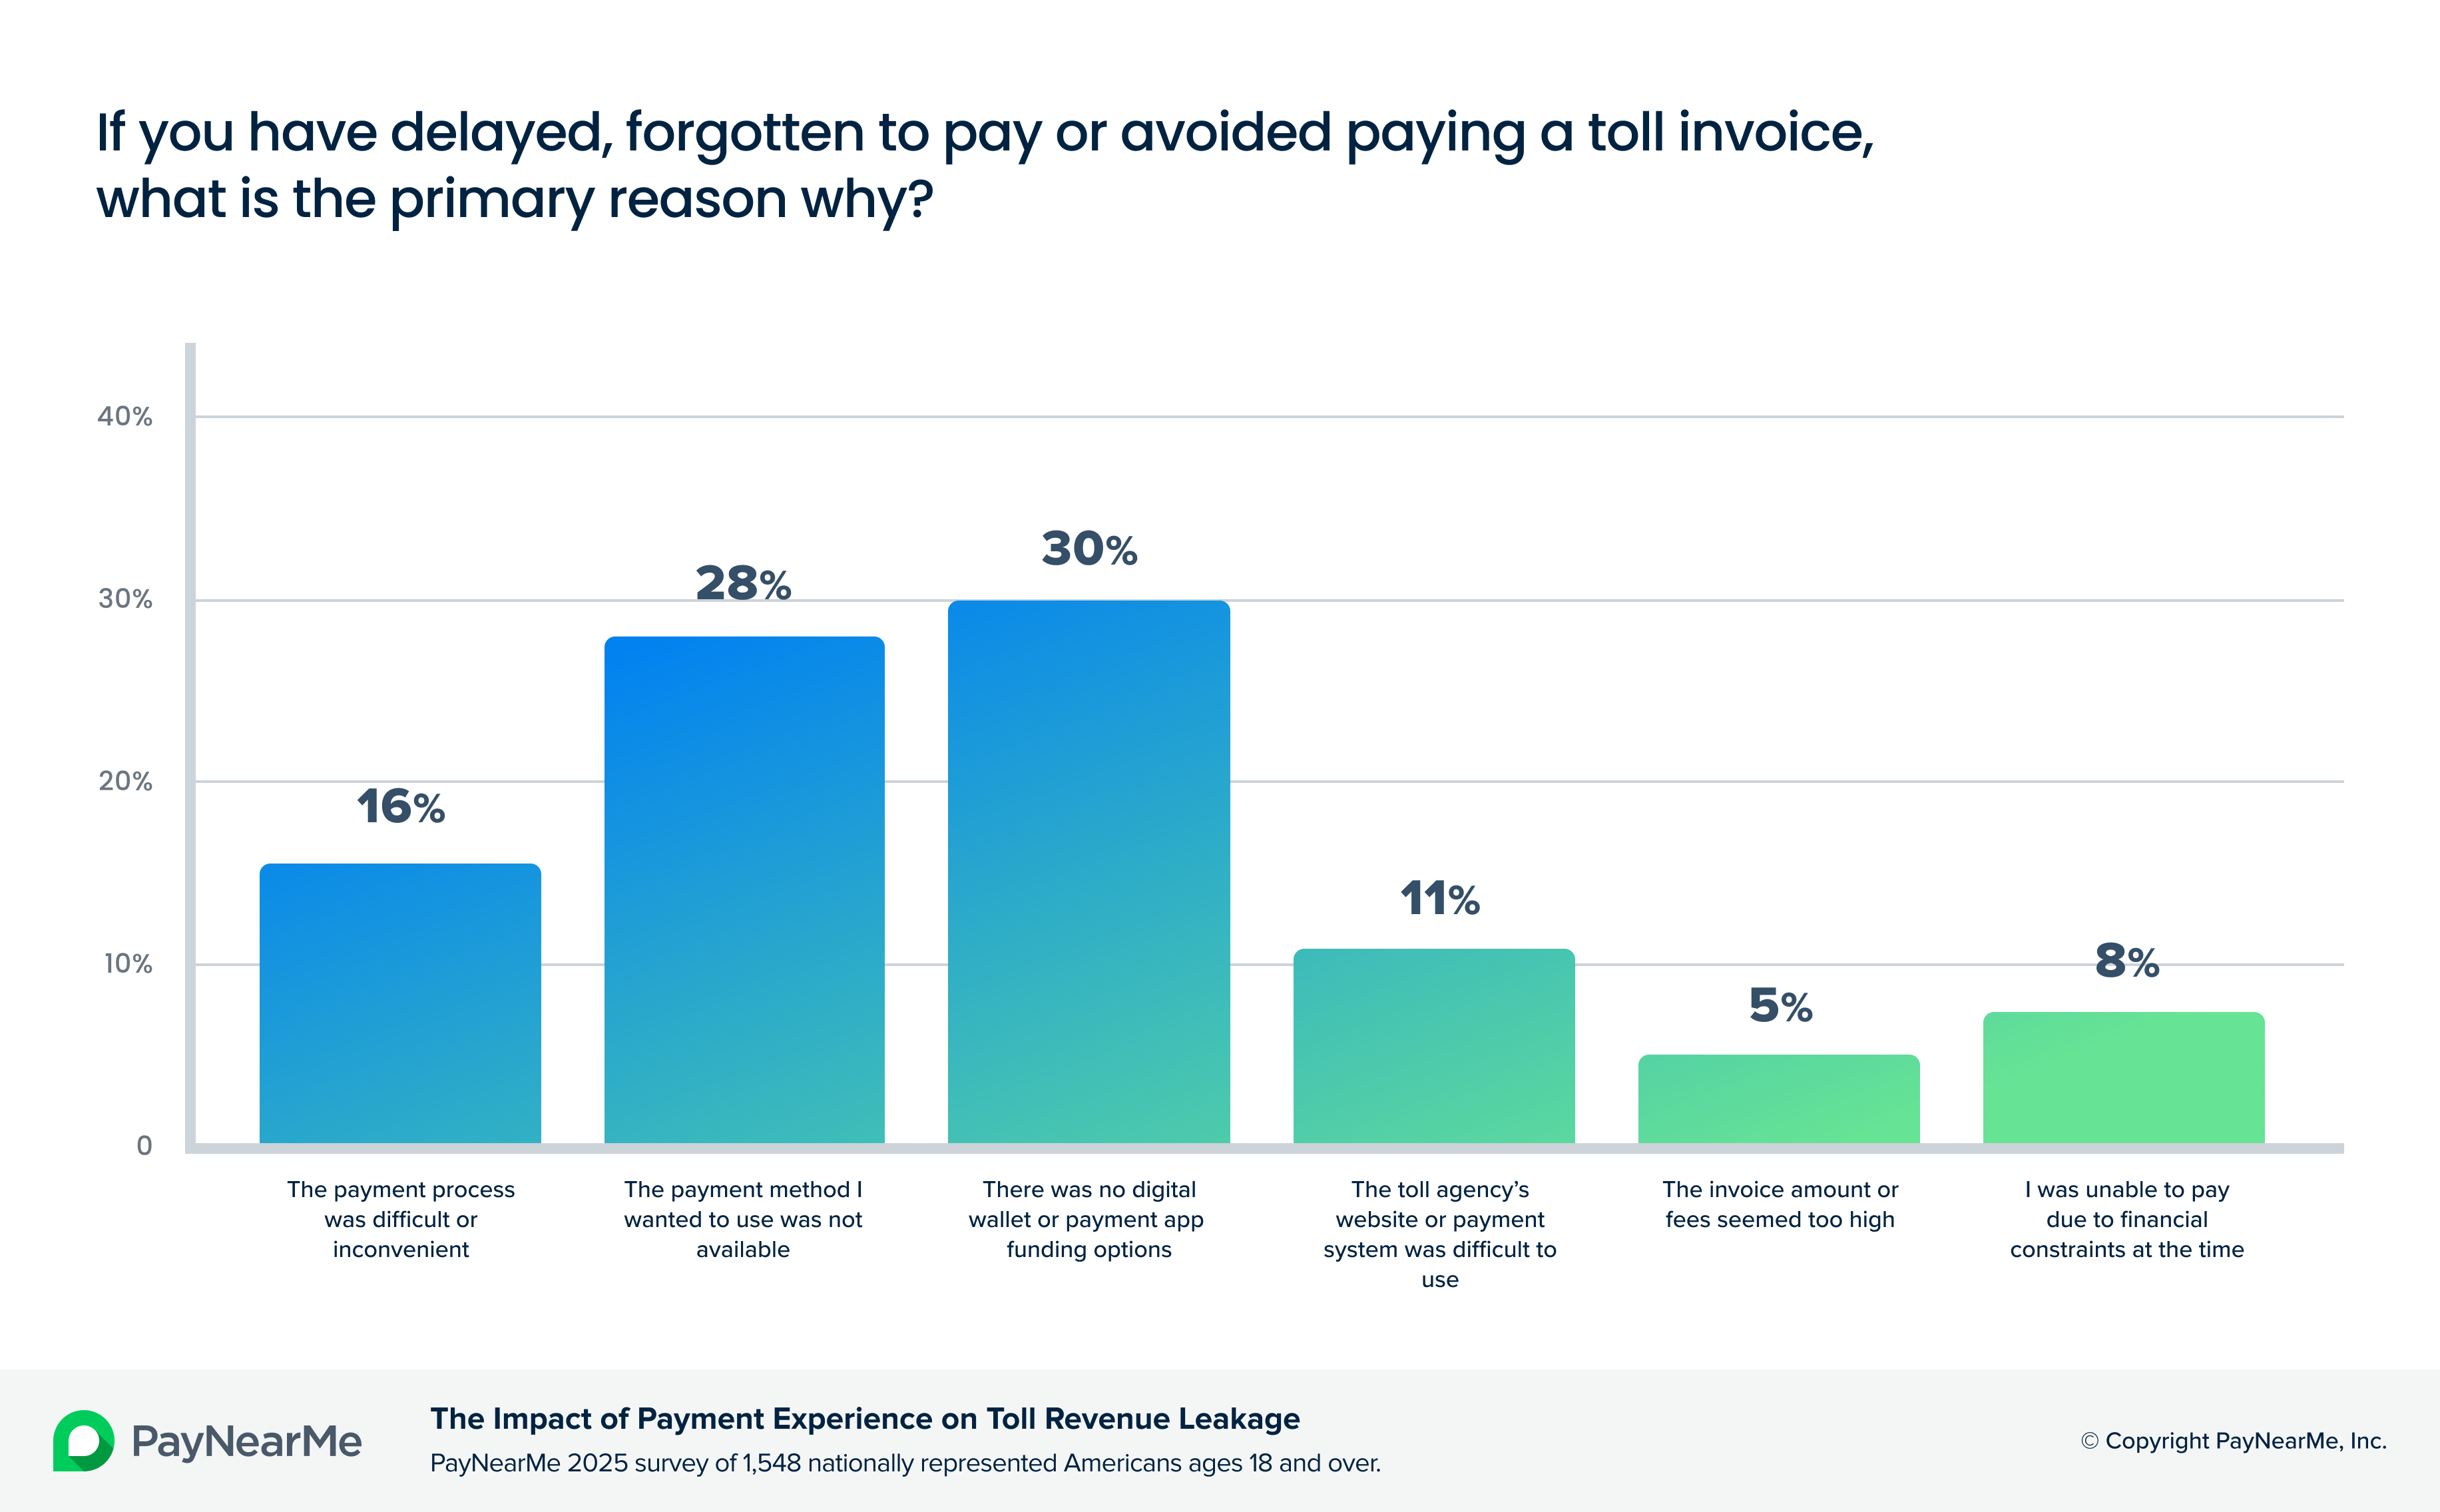 Why drivers delayed paying invoices
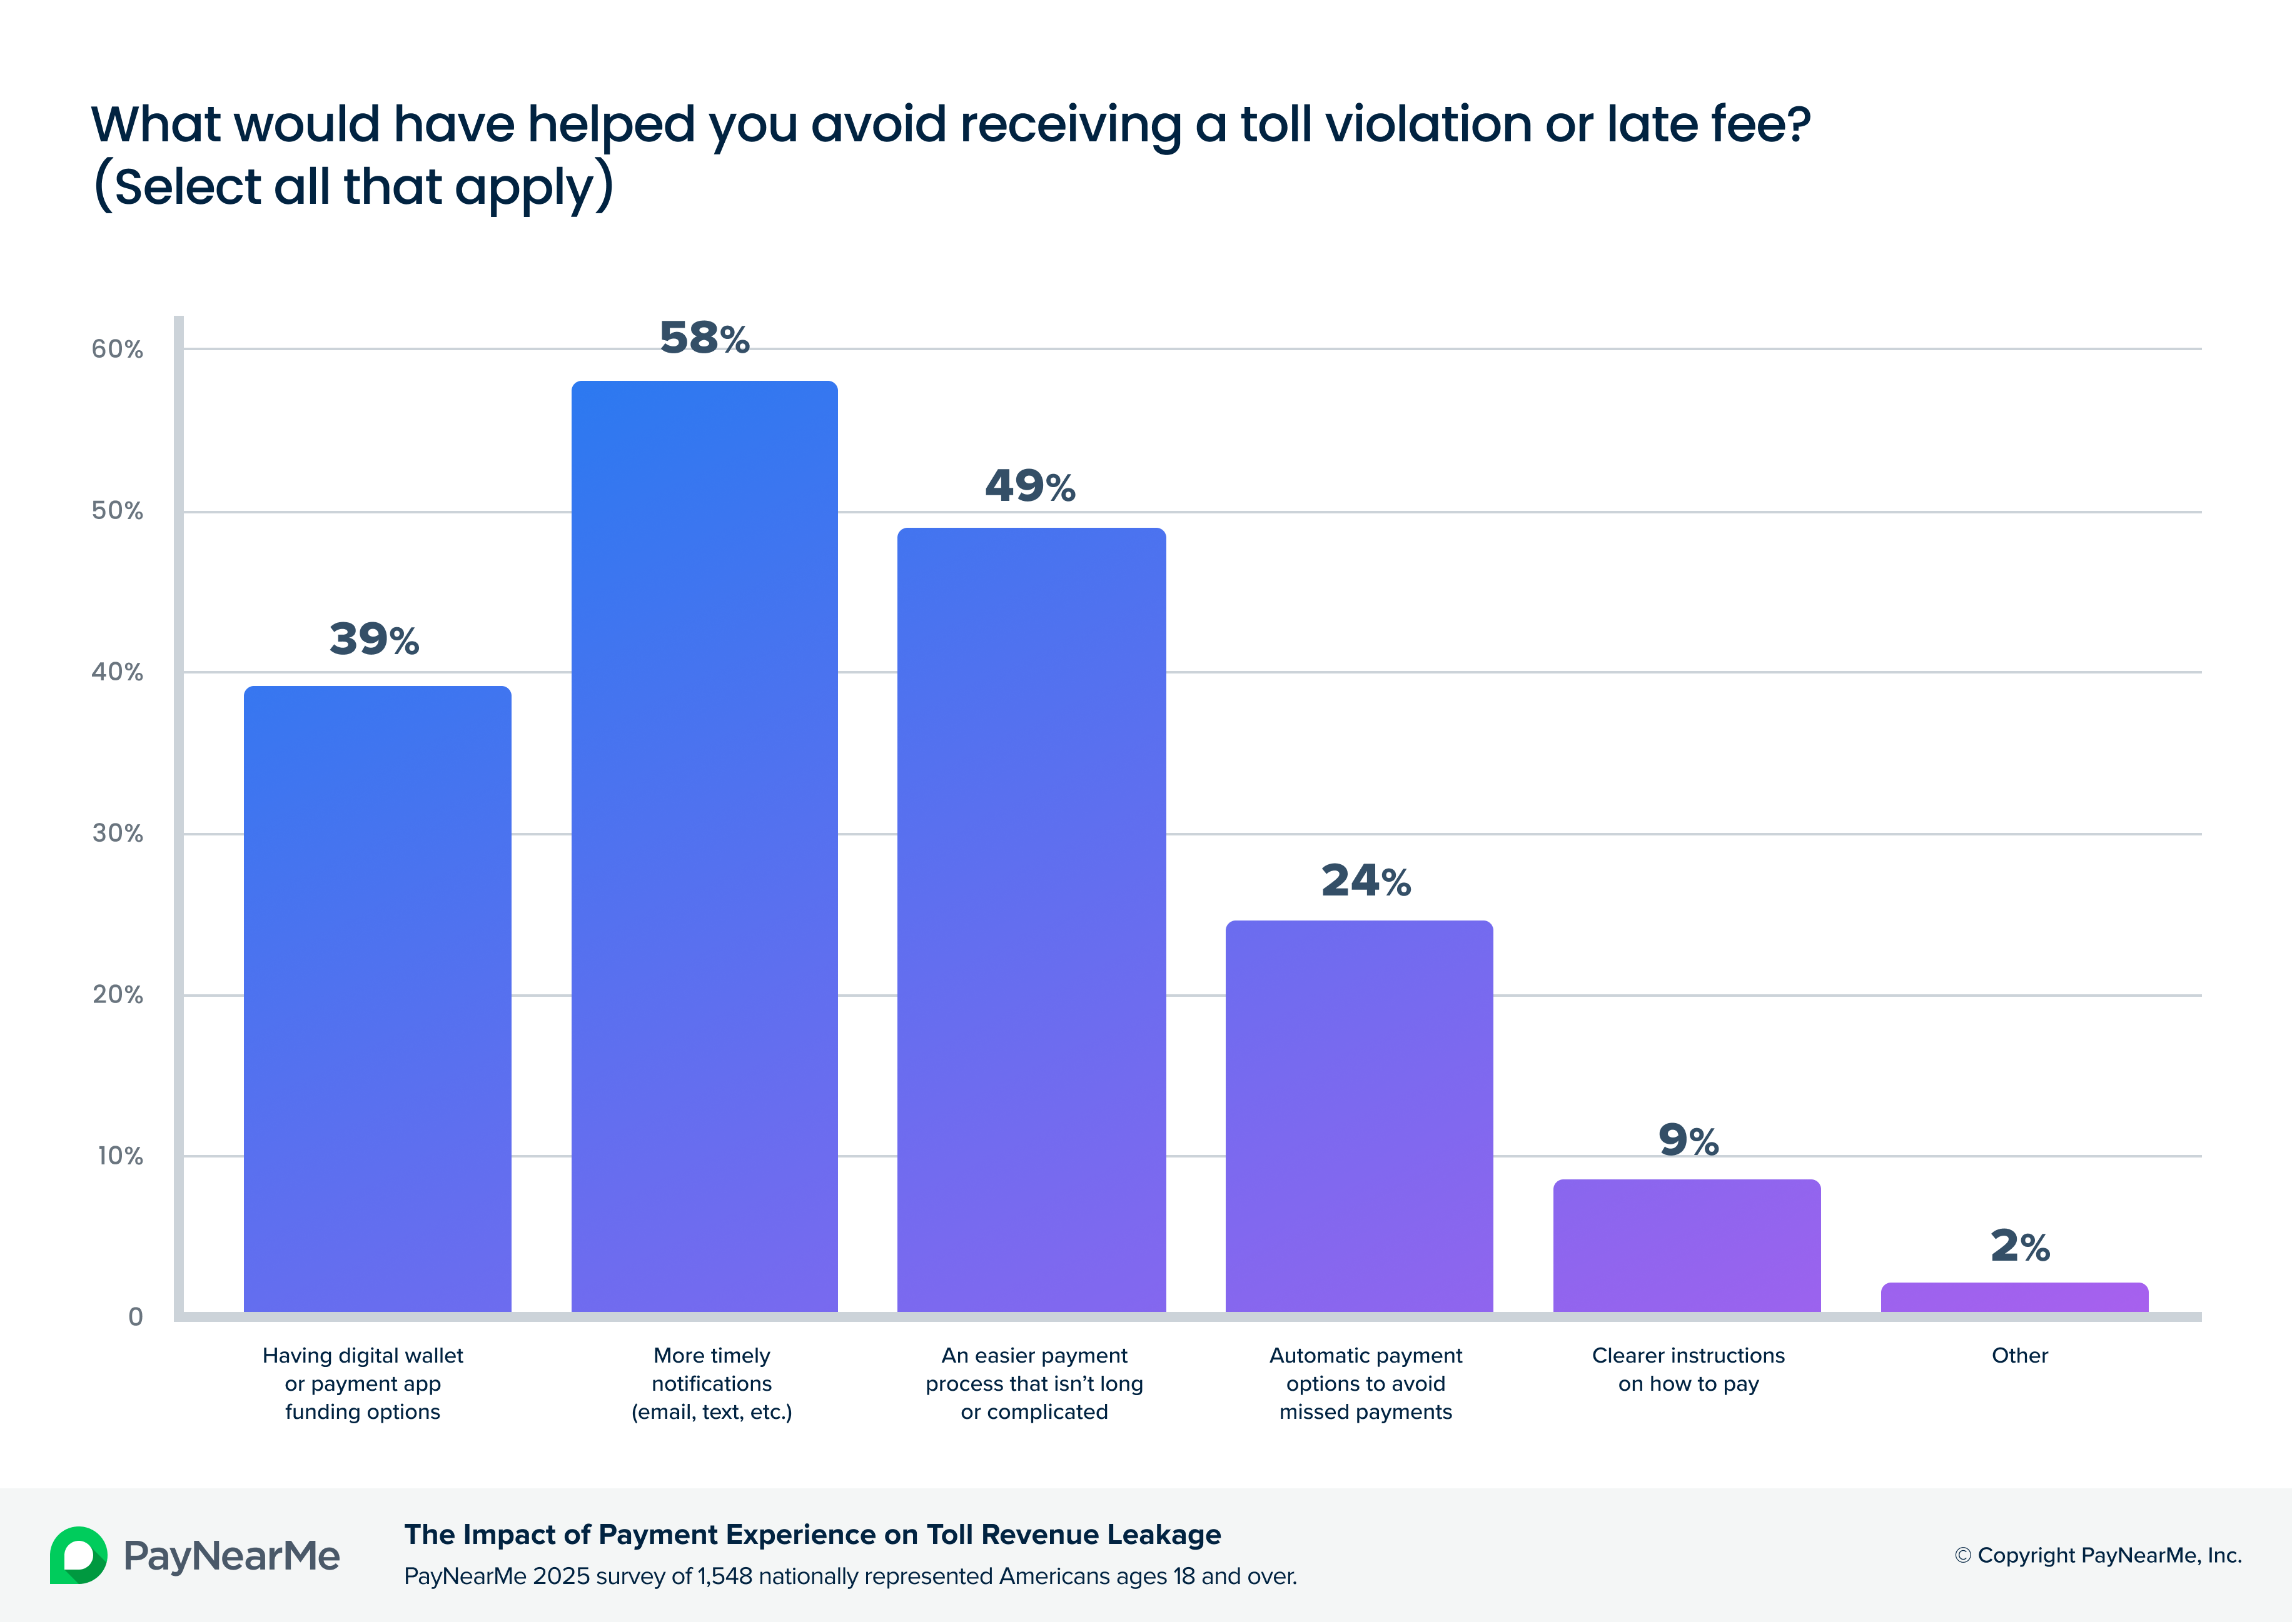 What helps drivers avoid violations
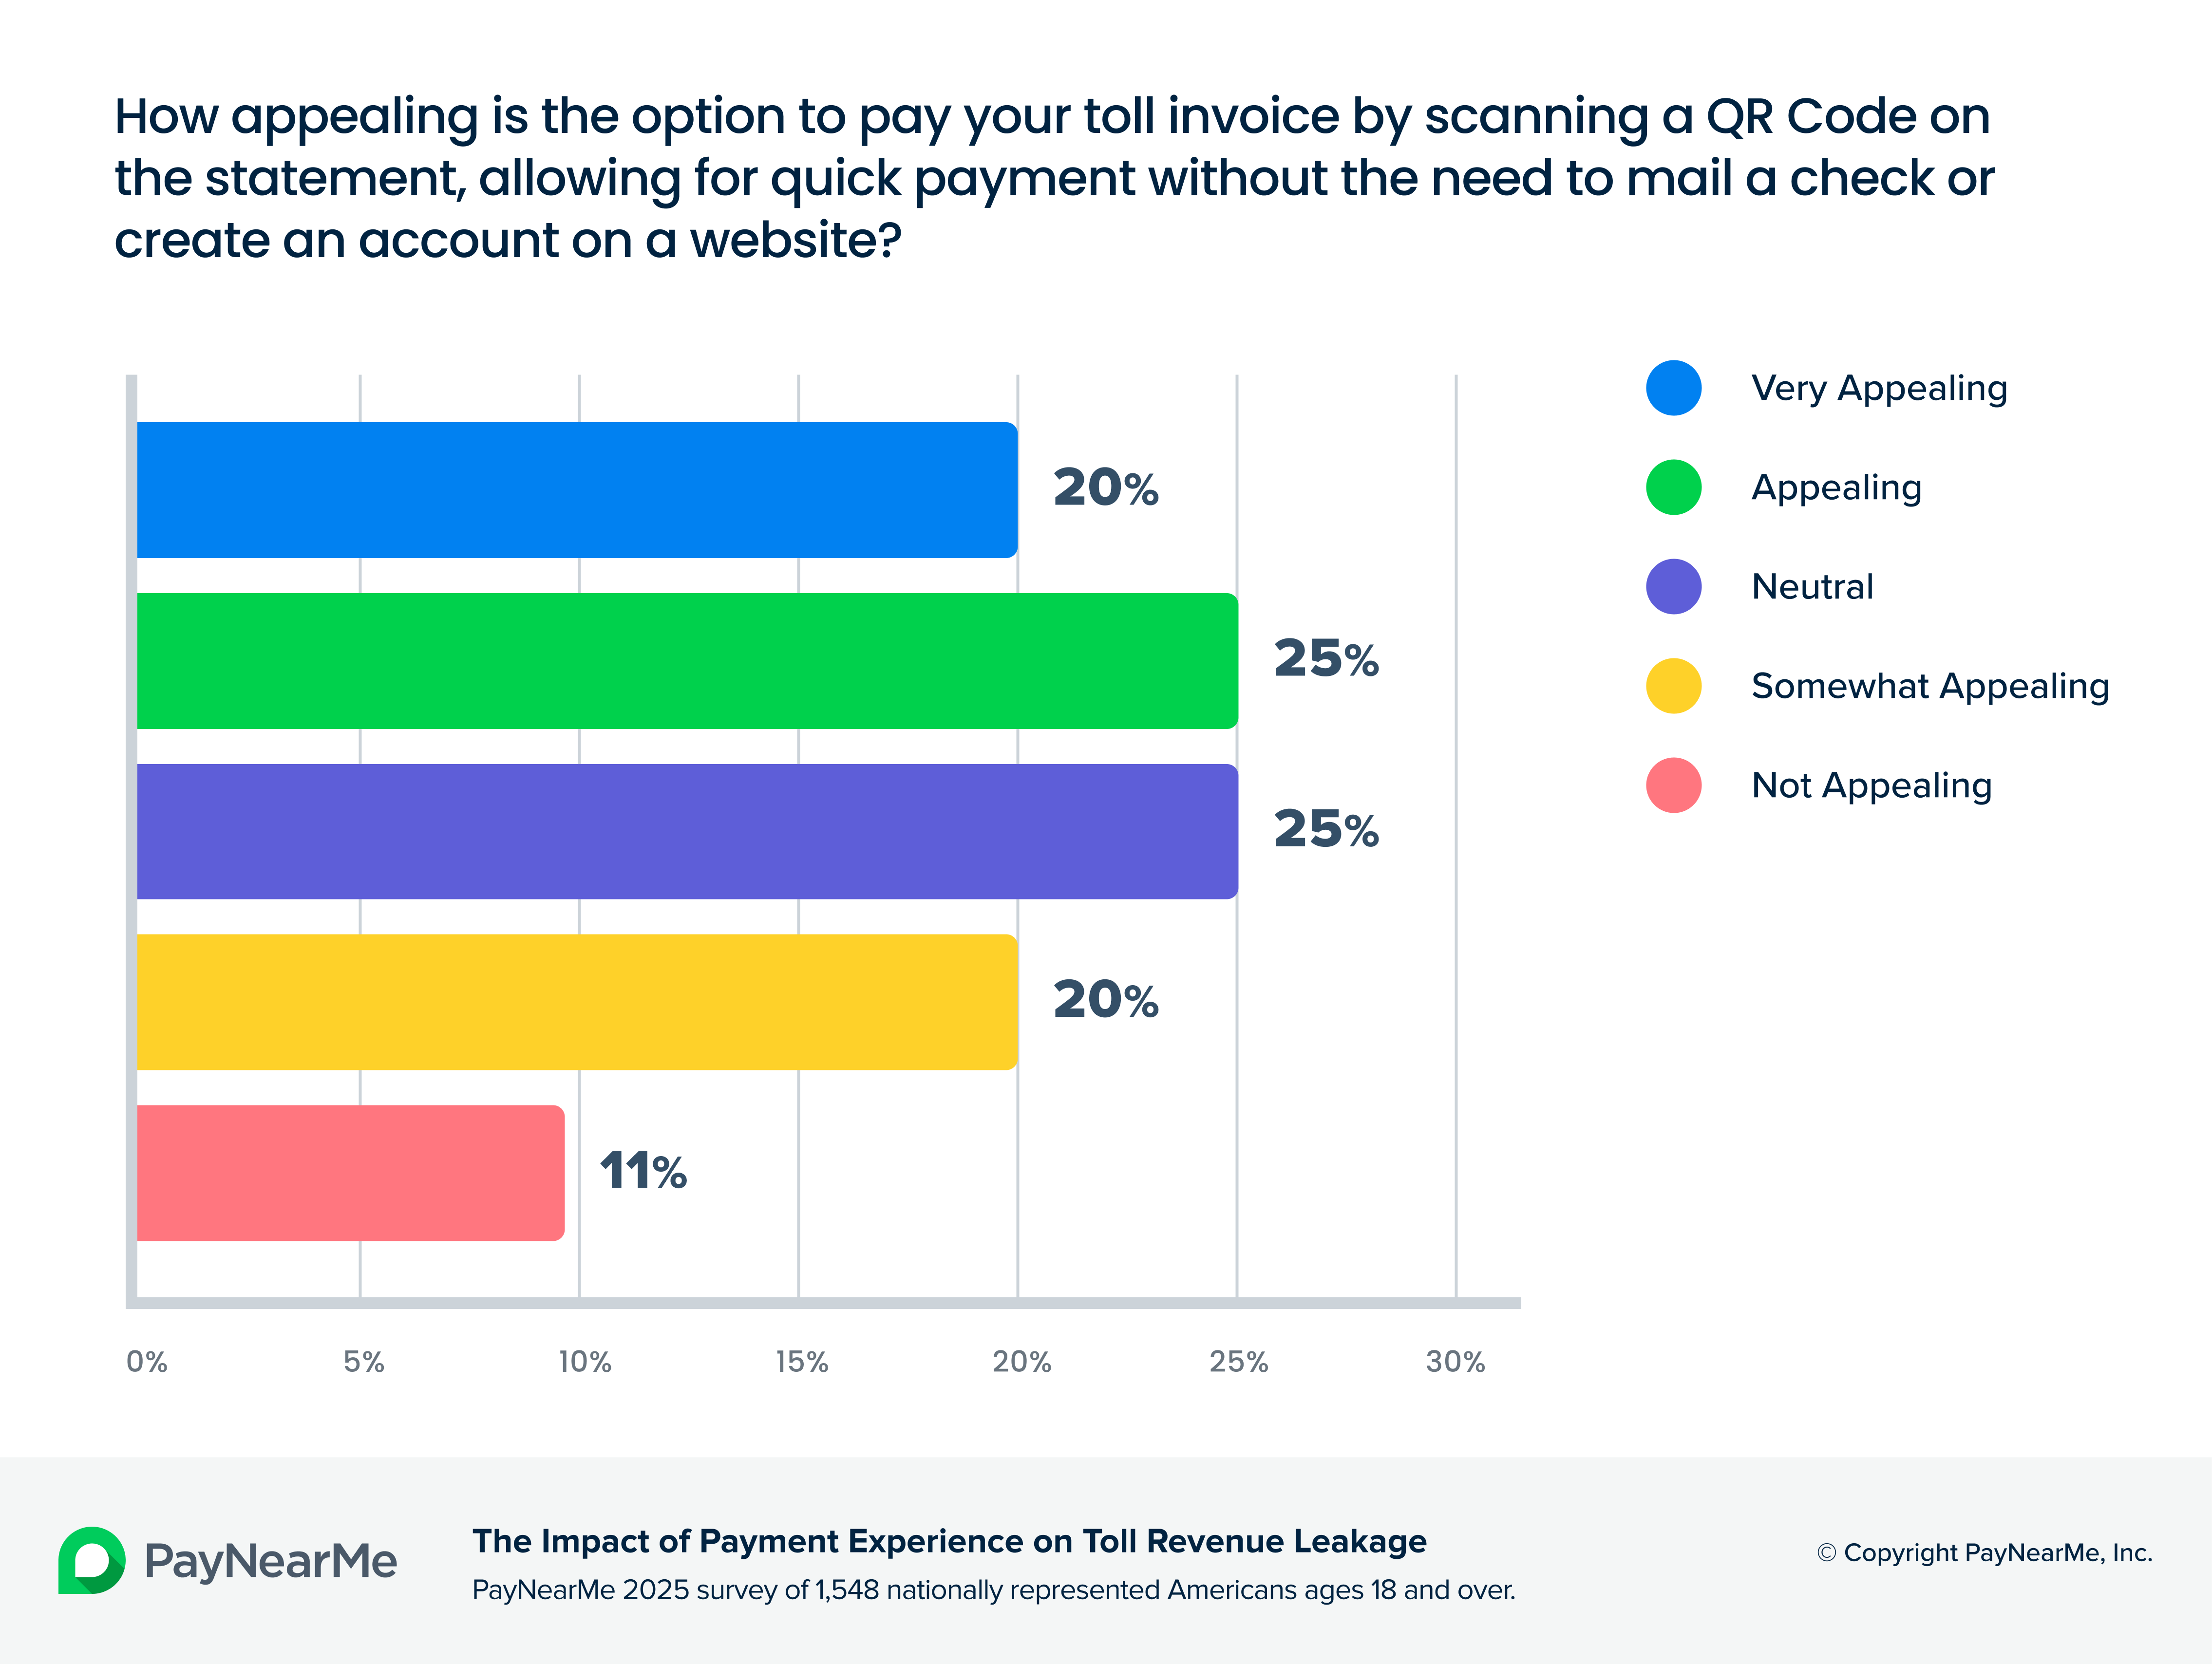 How appealing QR codes are
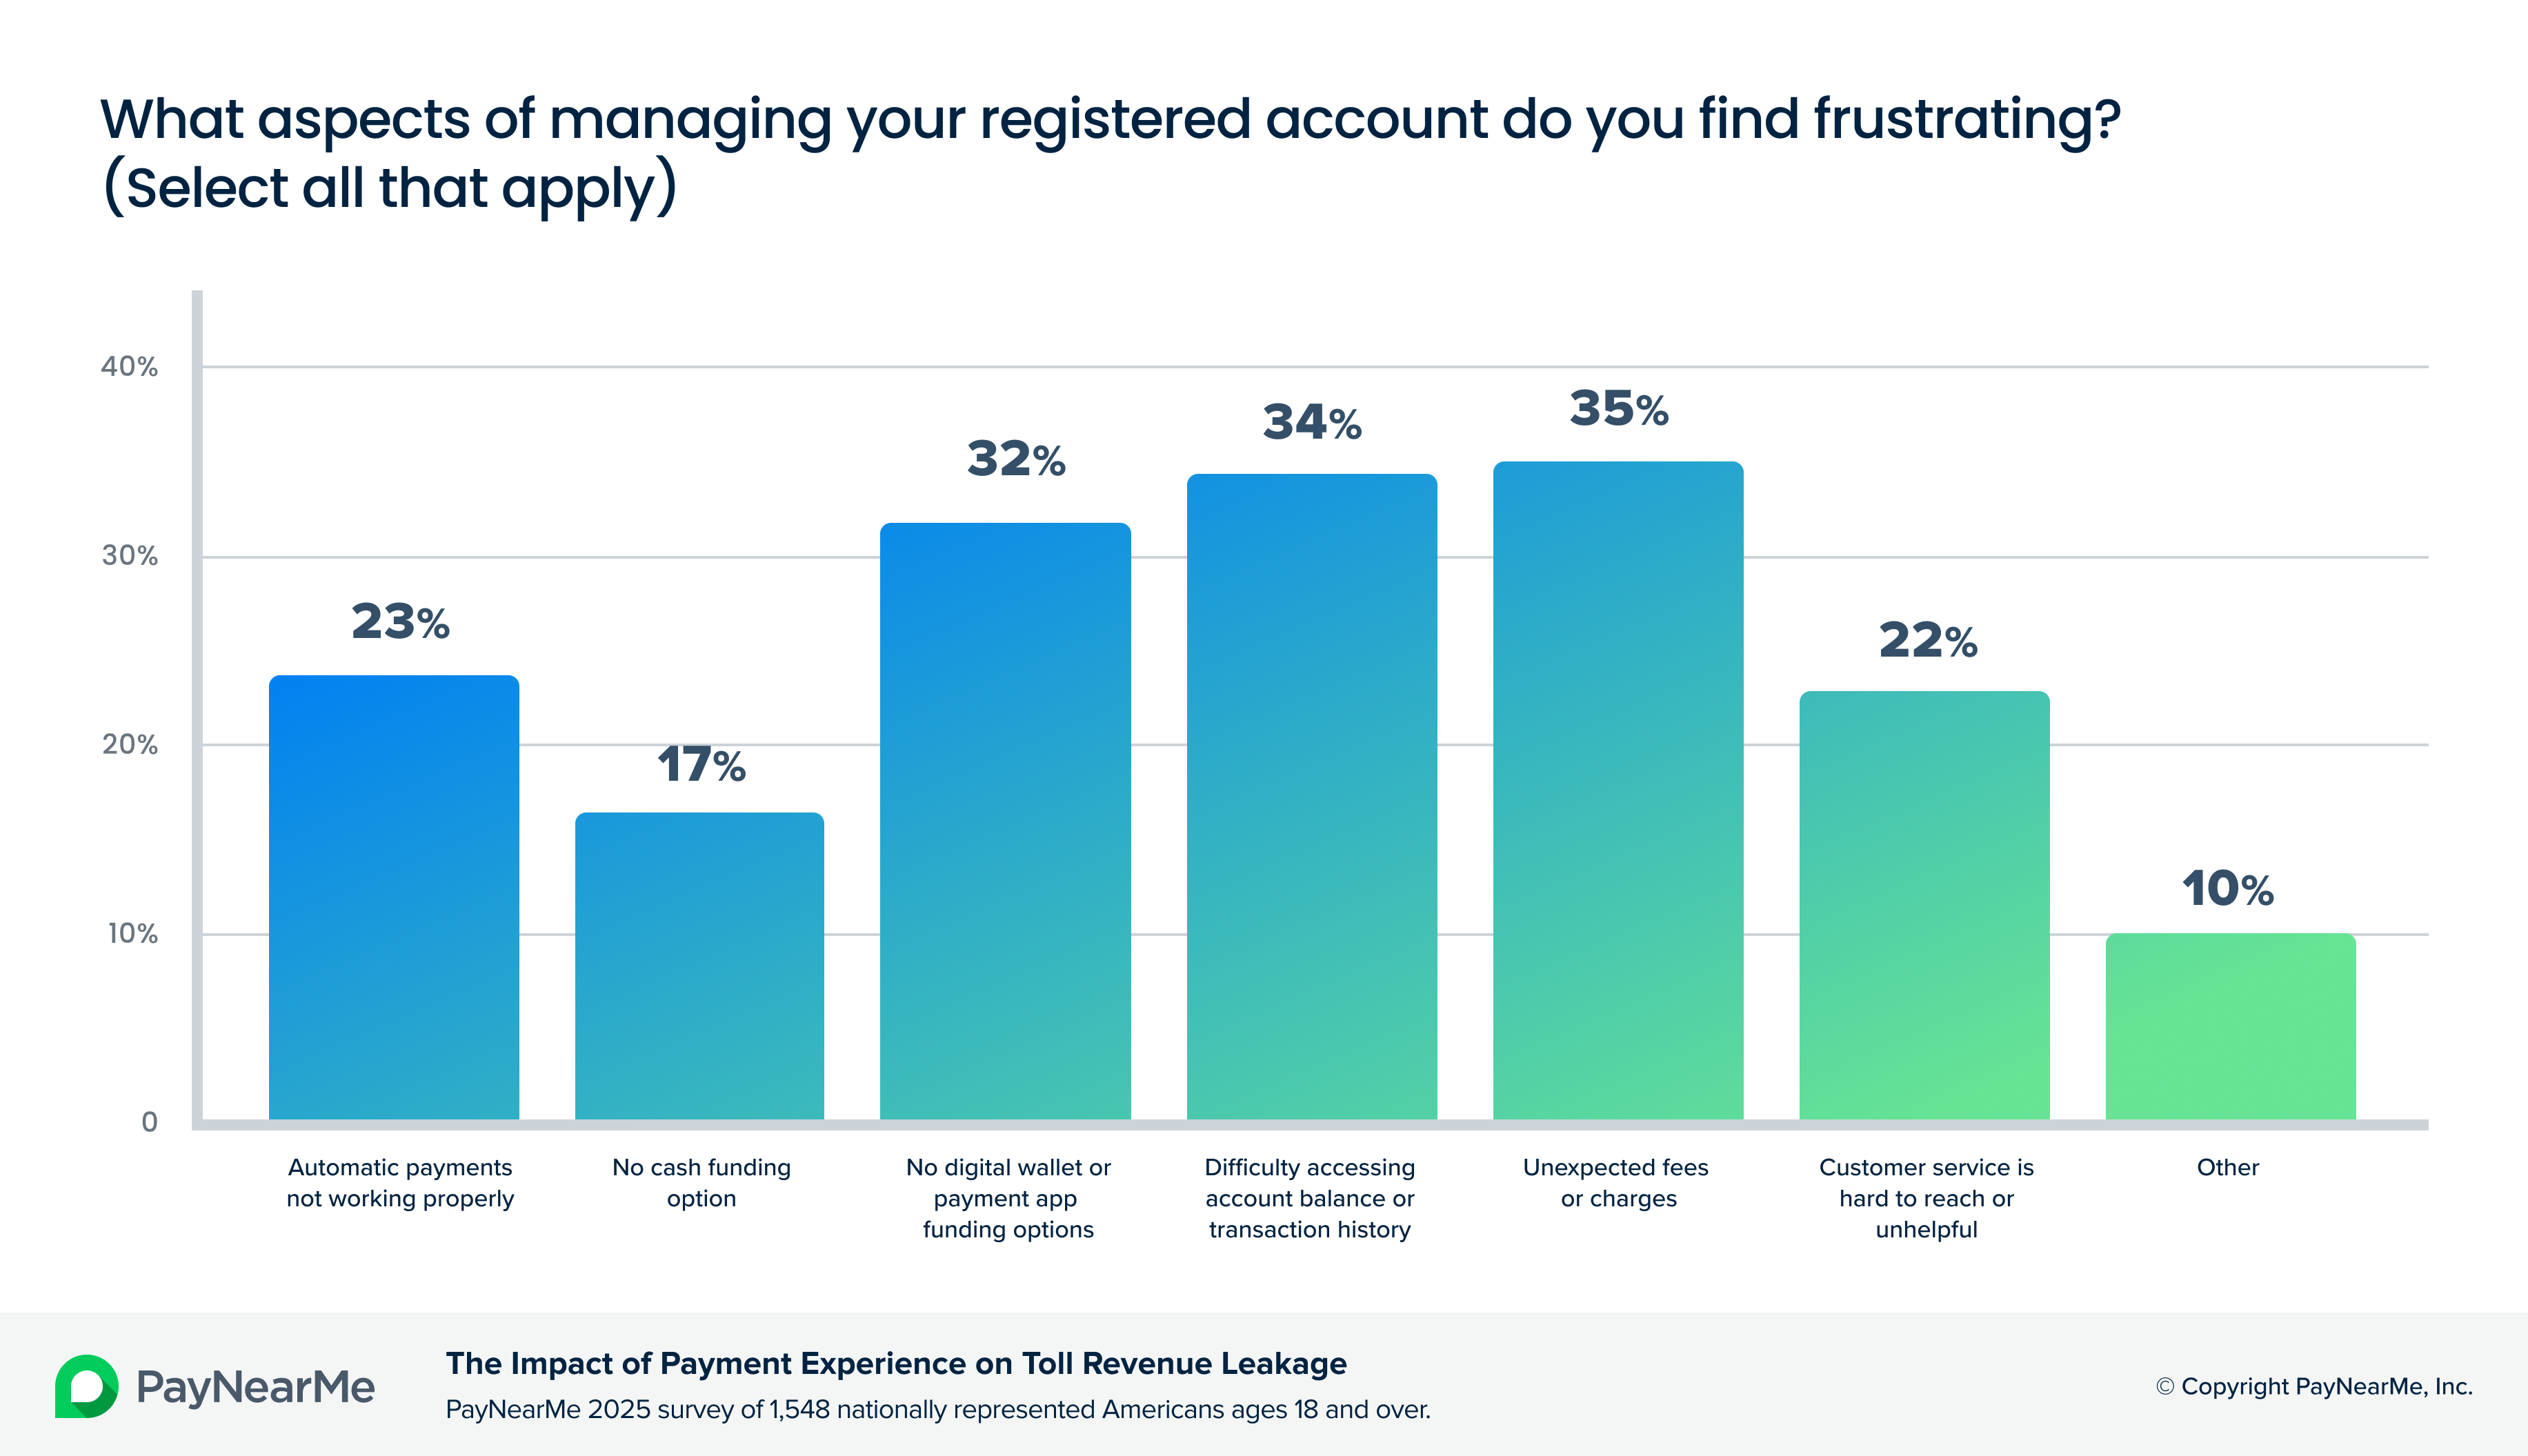 What makes registered accounts frustrating
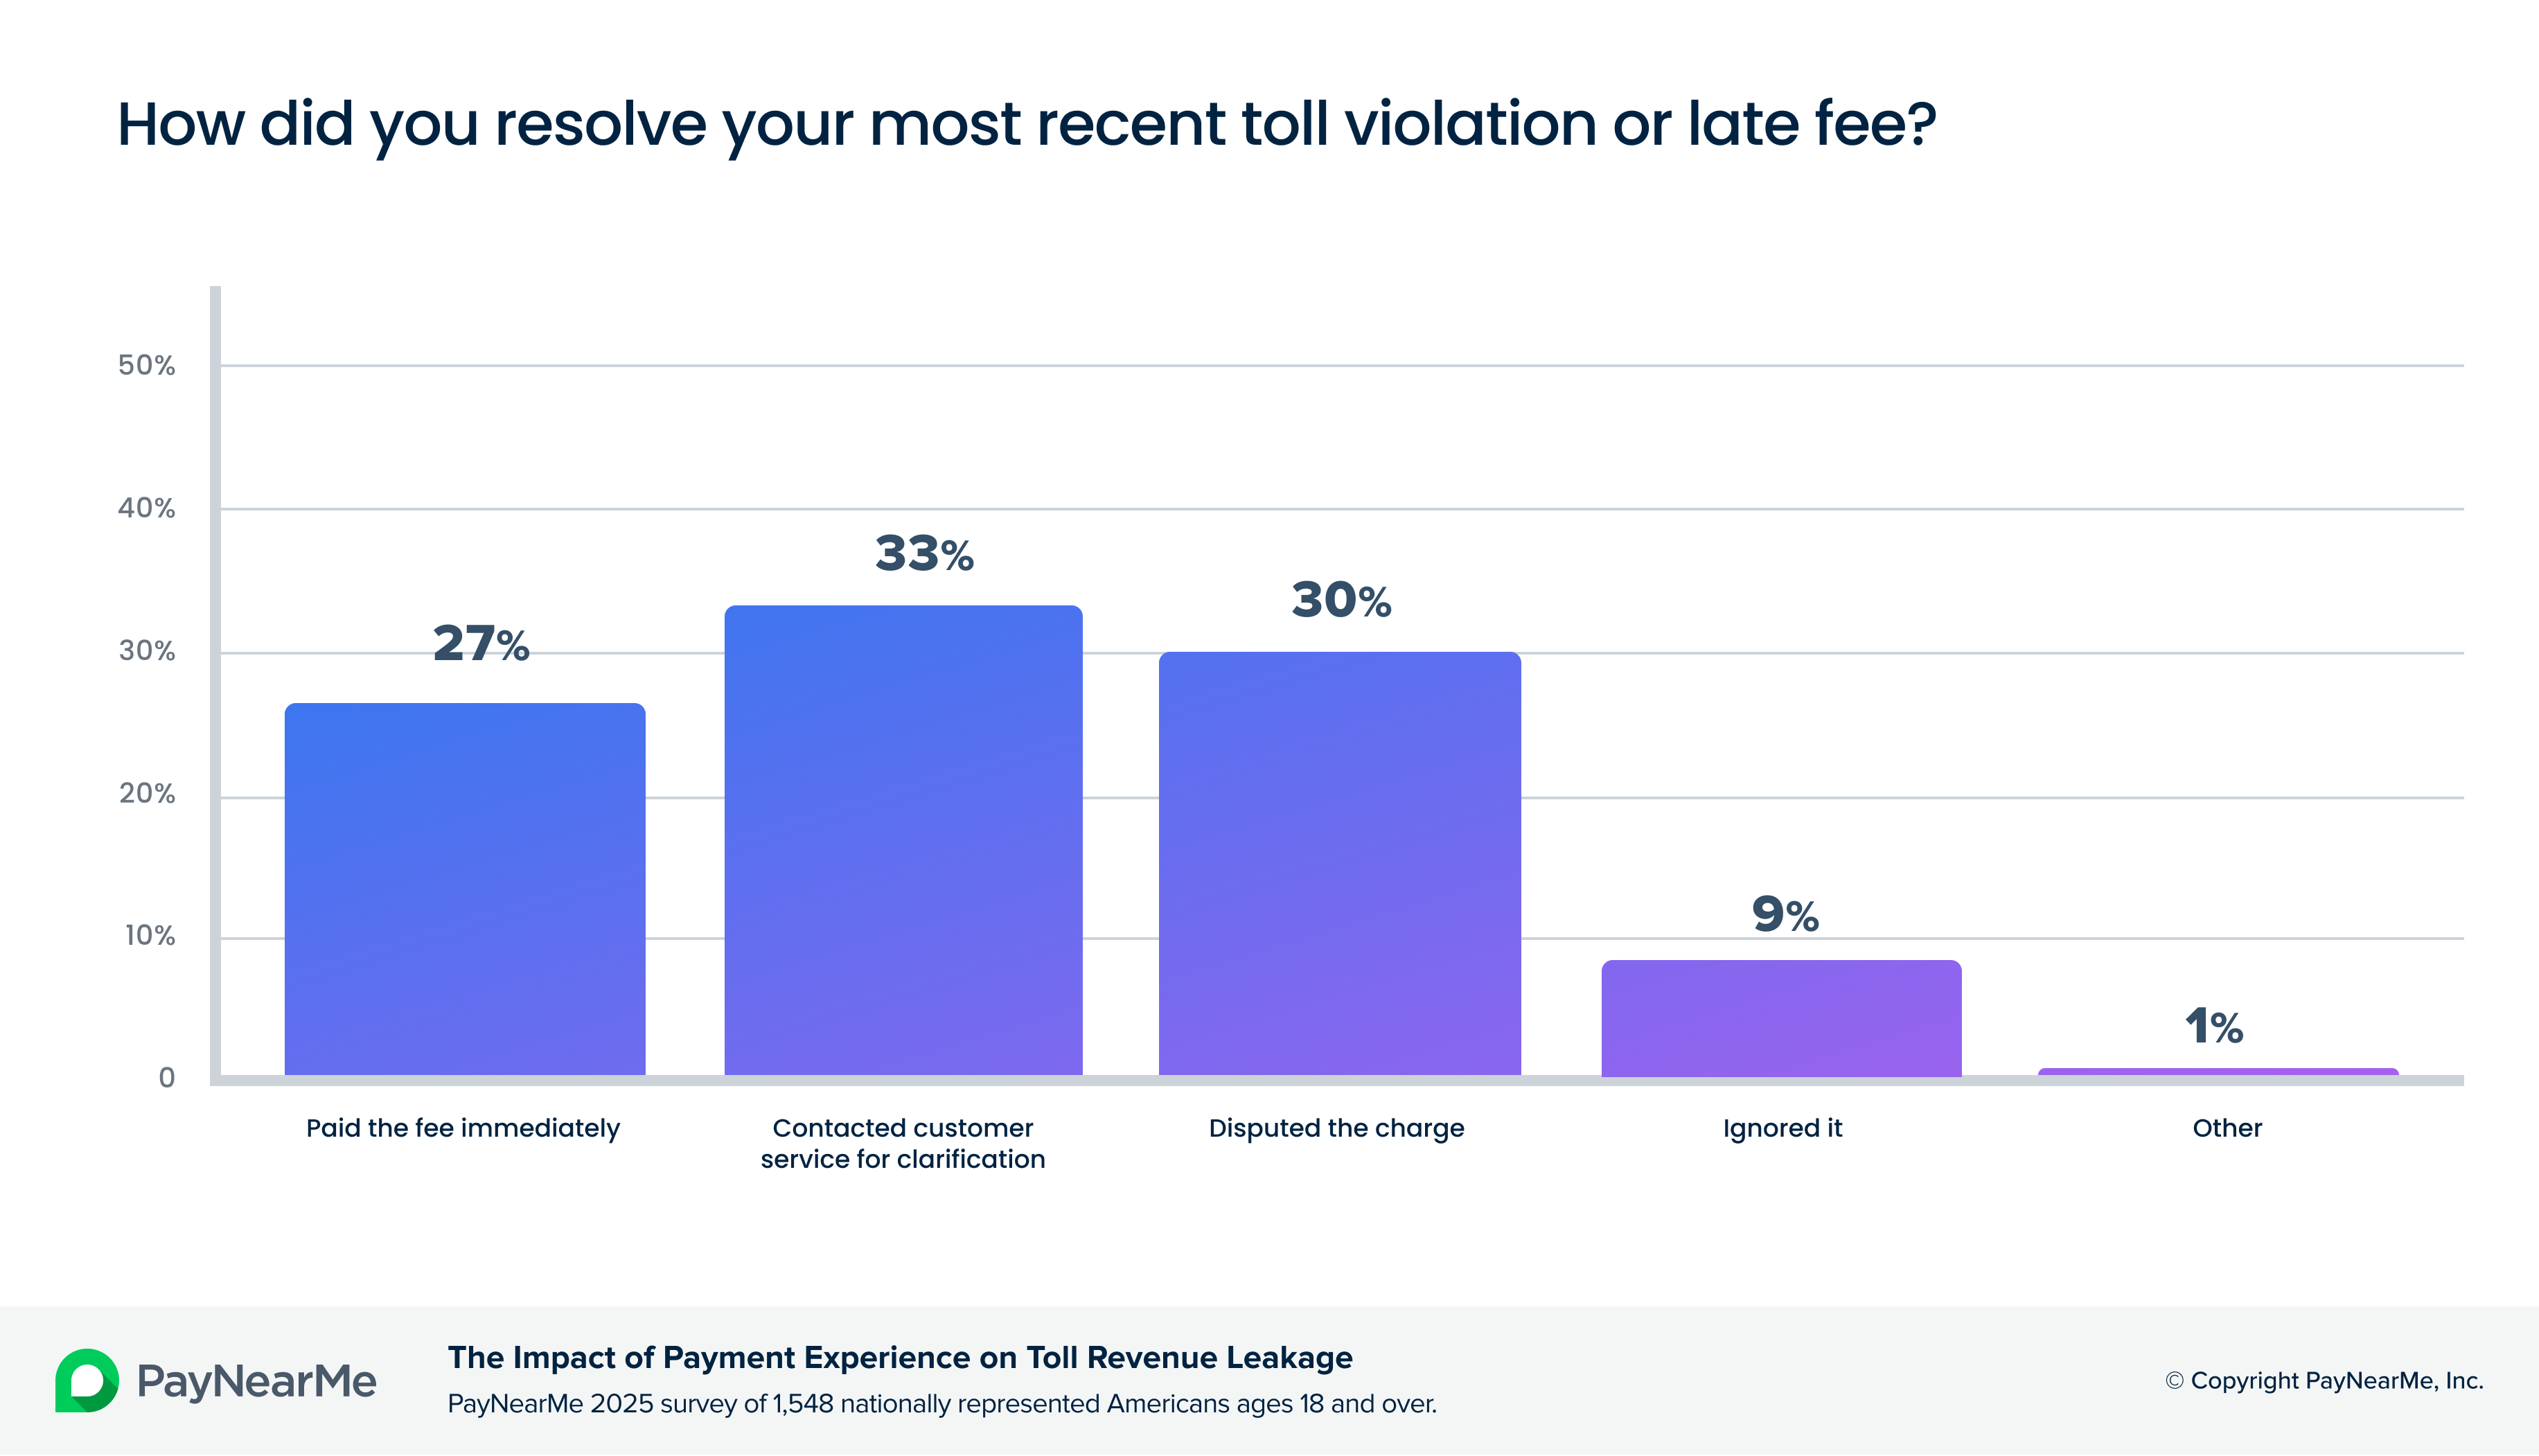 How drivers resolve violations
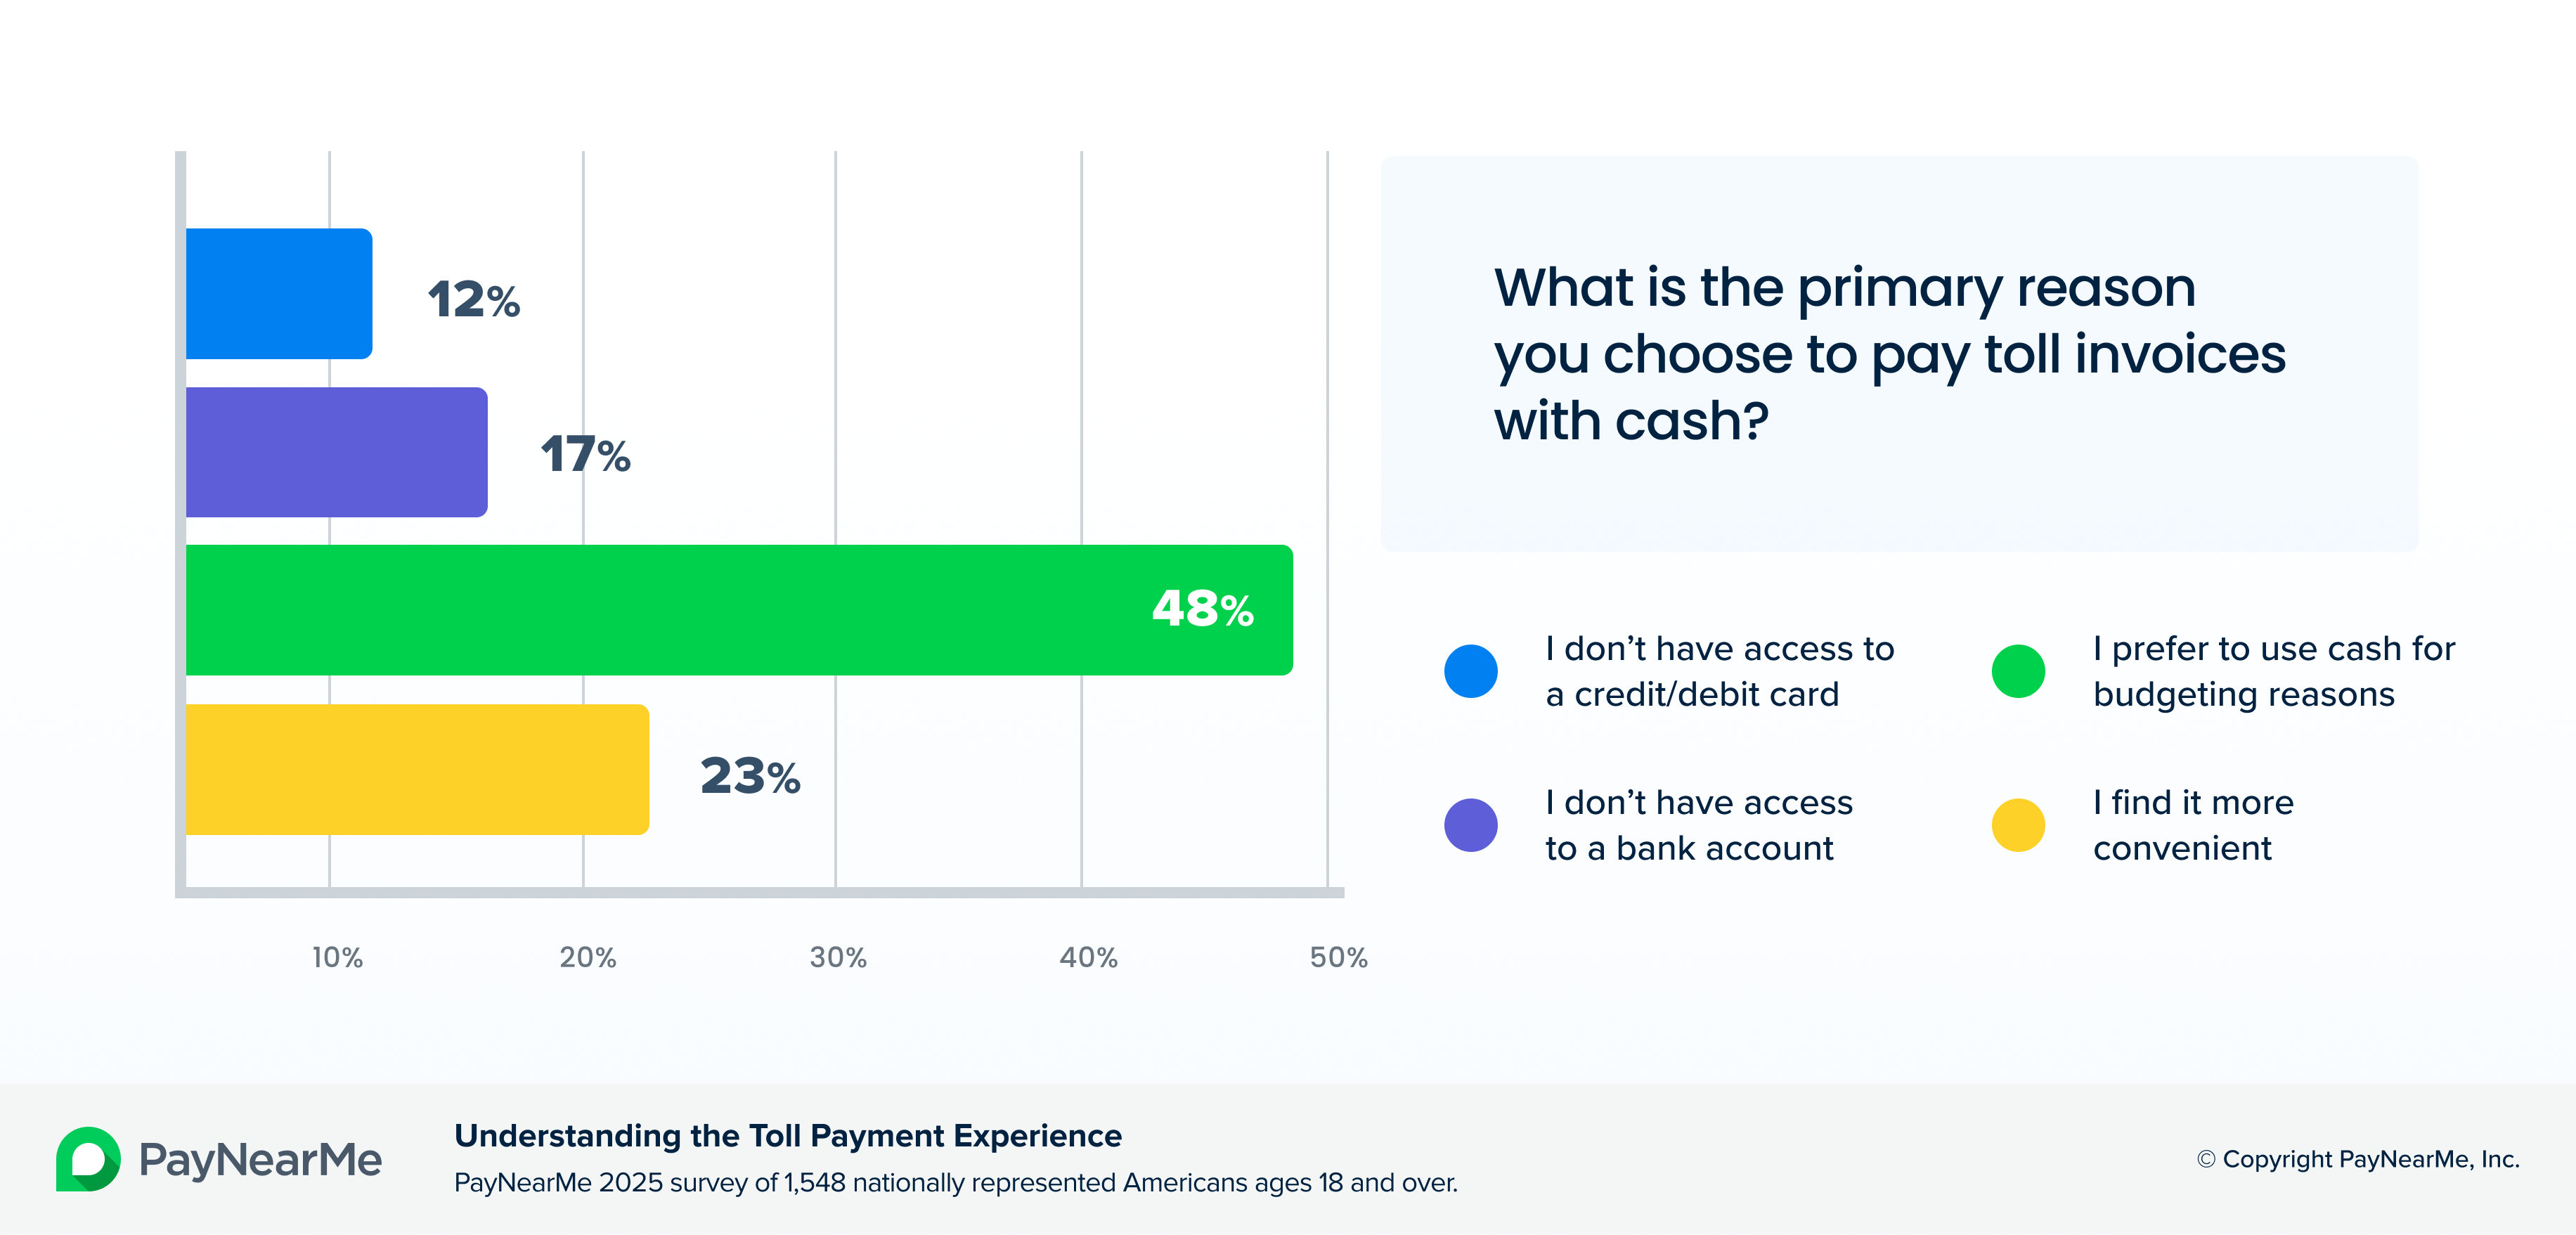 Why drivers want to pay with cash
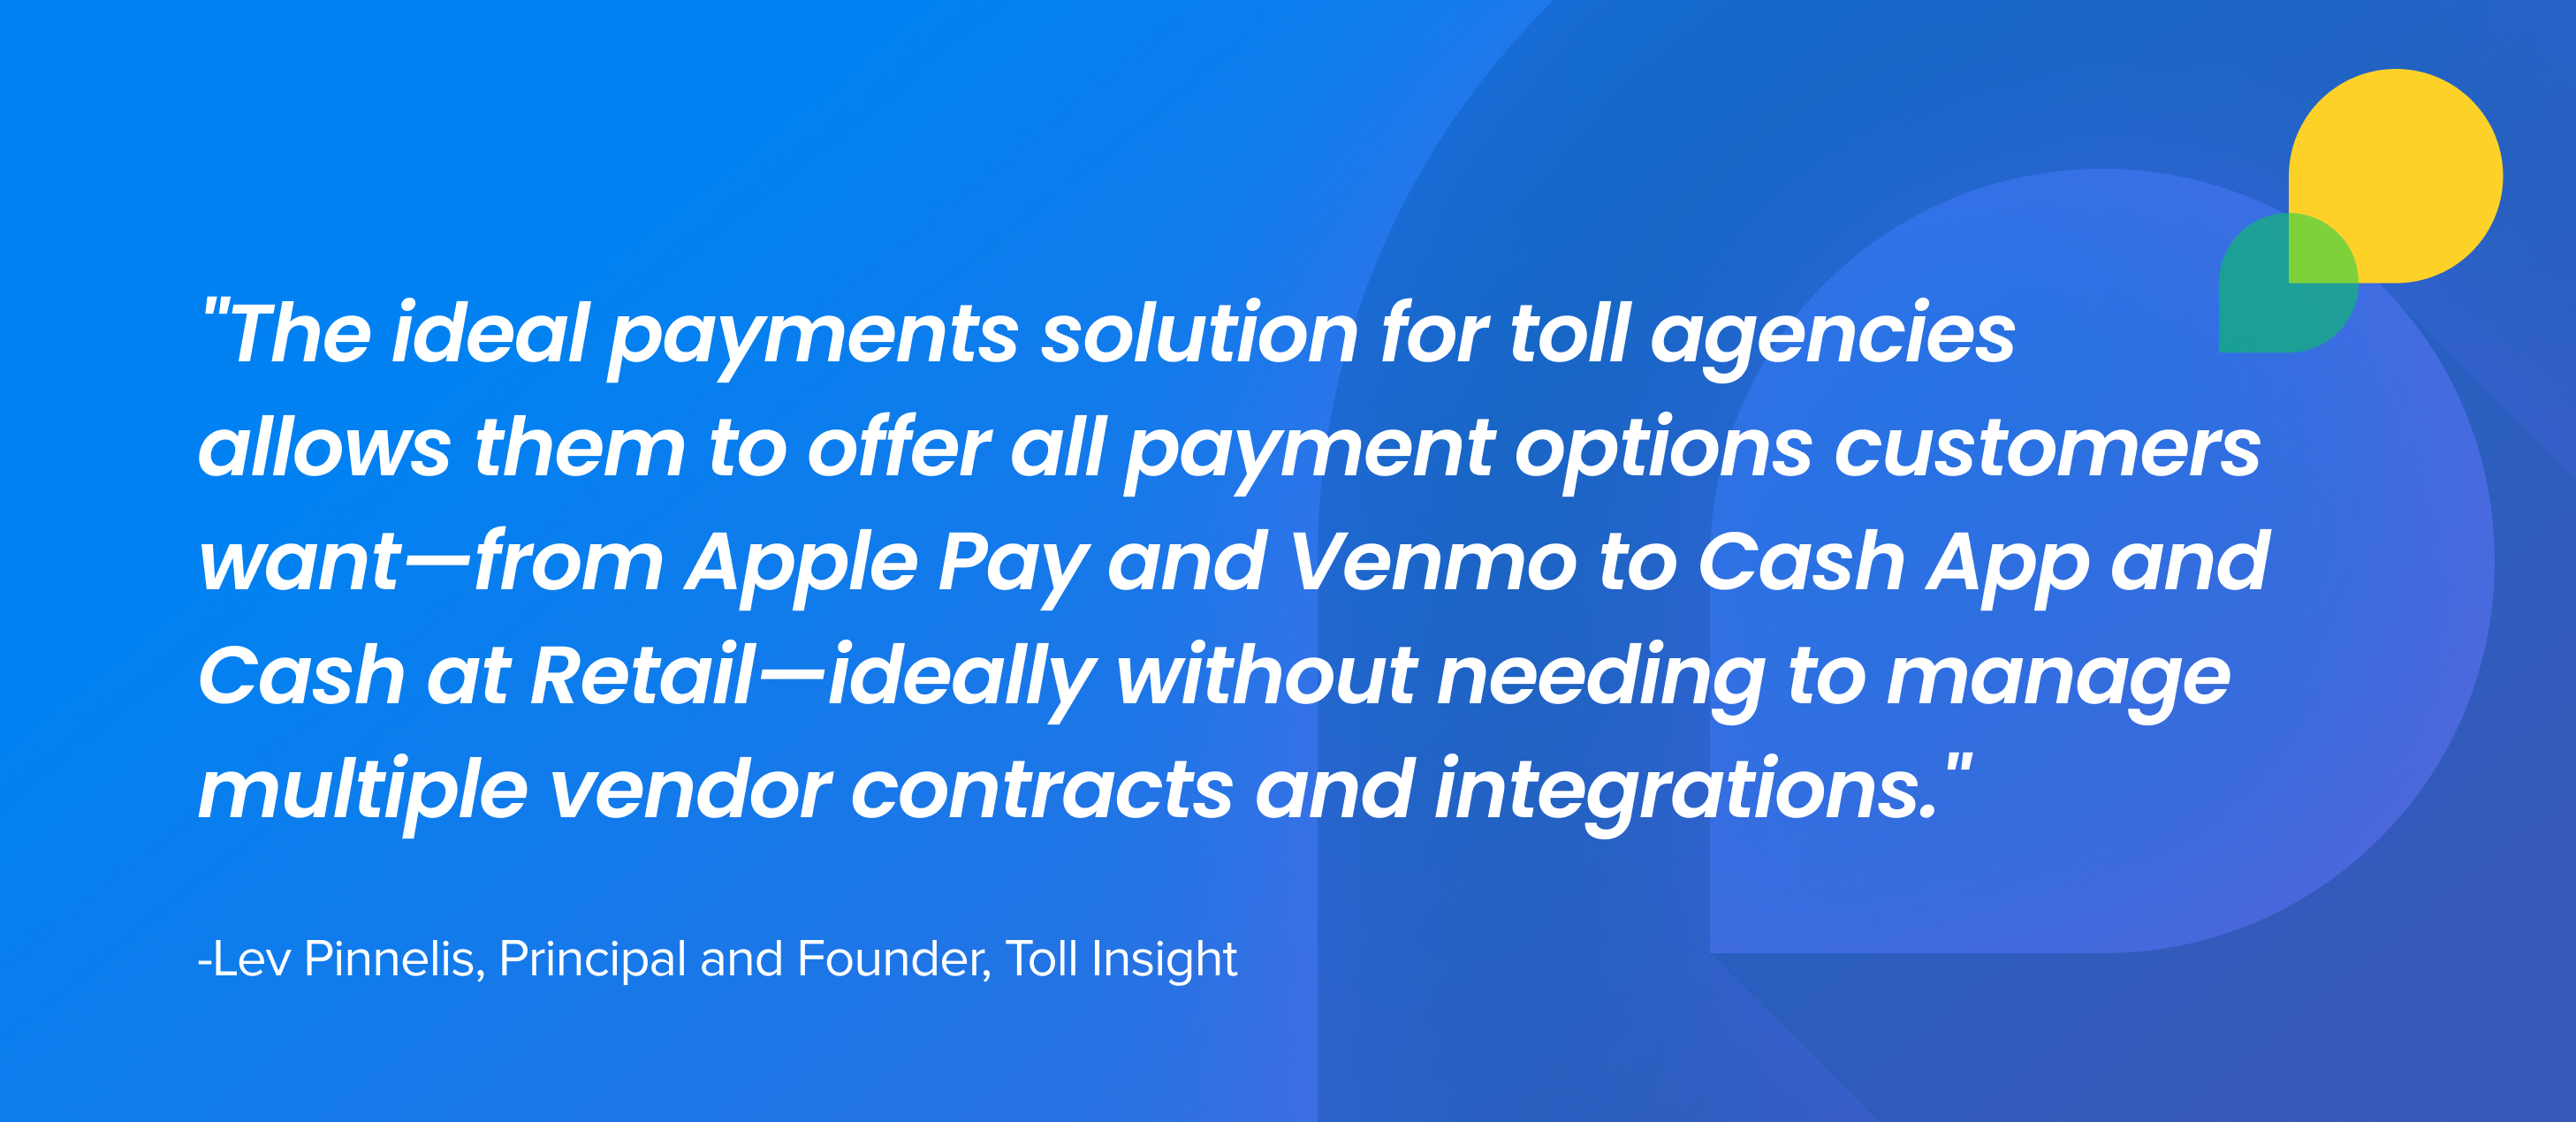 Quote from Lev Pinnelis, Toll Insight
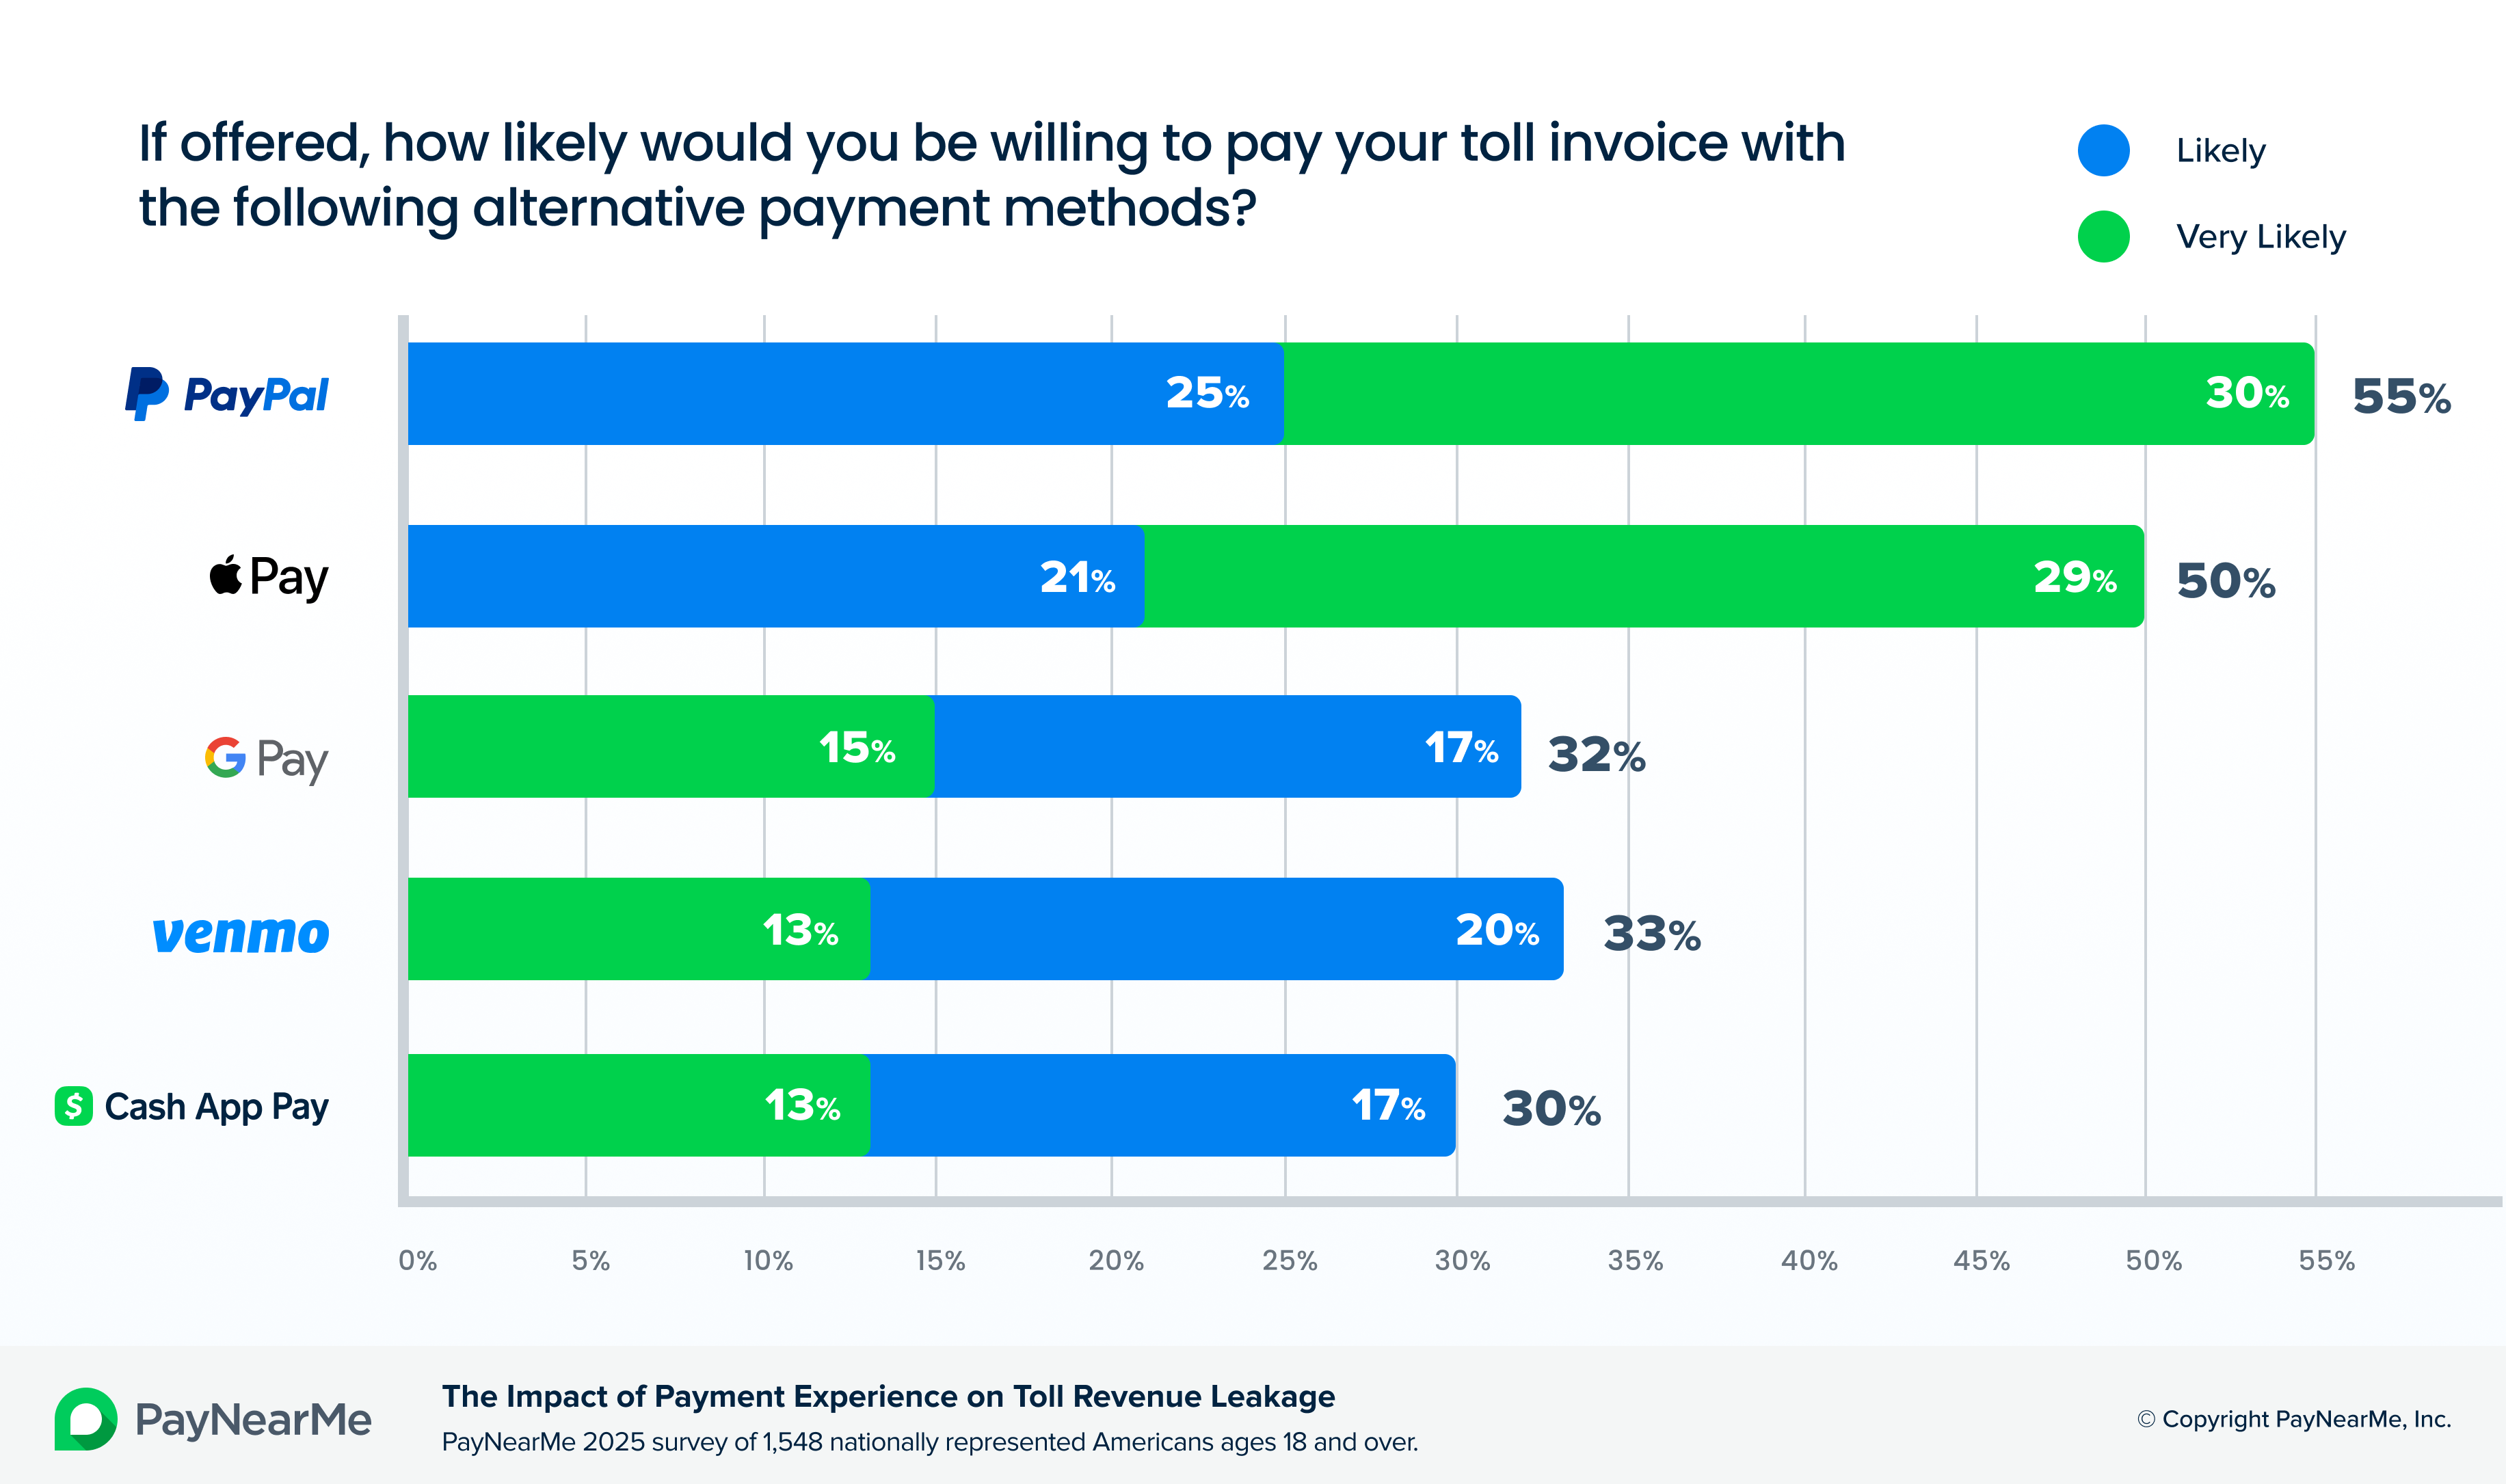 Alternative payment method preferences
From Gen Z to Baby Boomers: Understanding Generational Loan Payment Preferences
This report explores the payment preferences of each generation of loan payers.
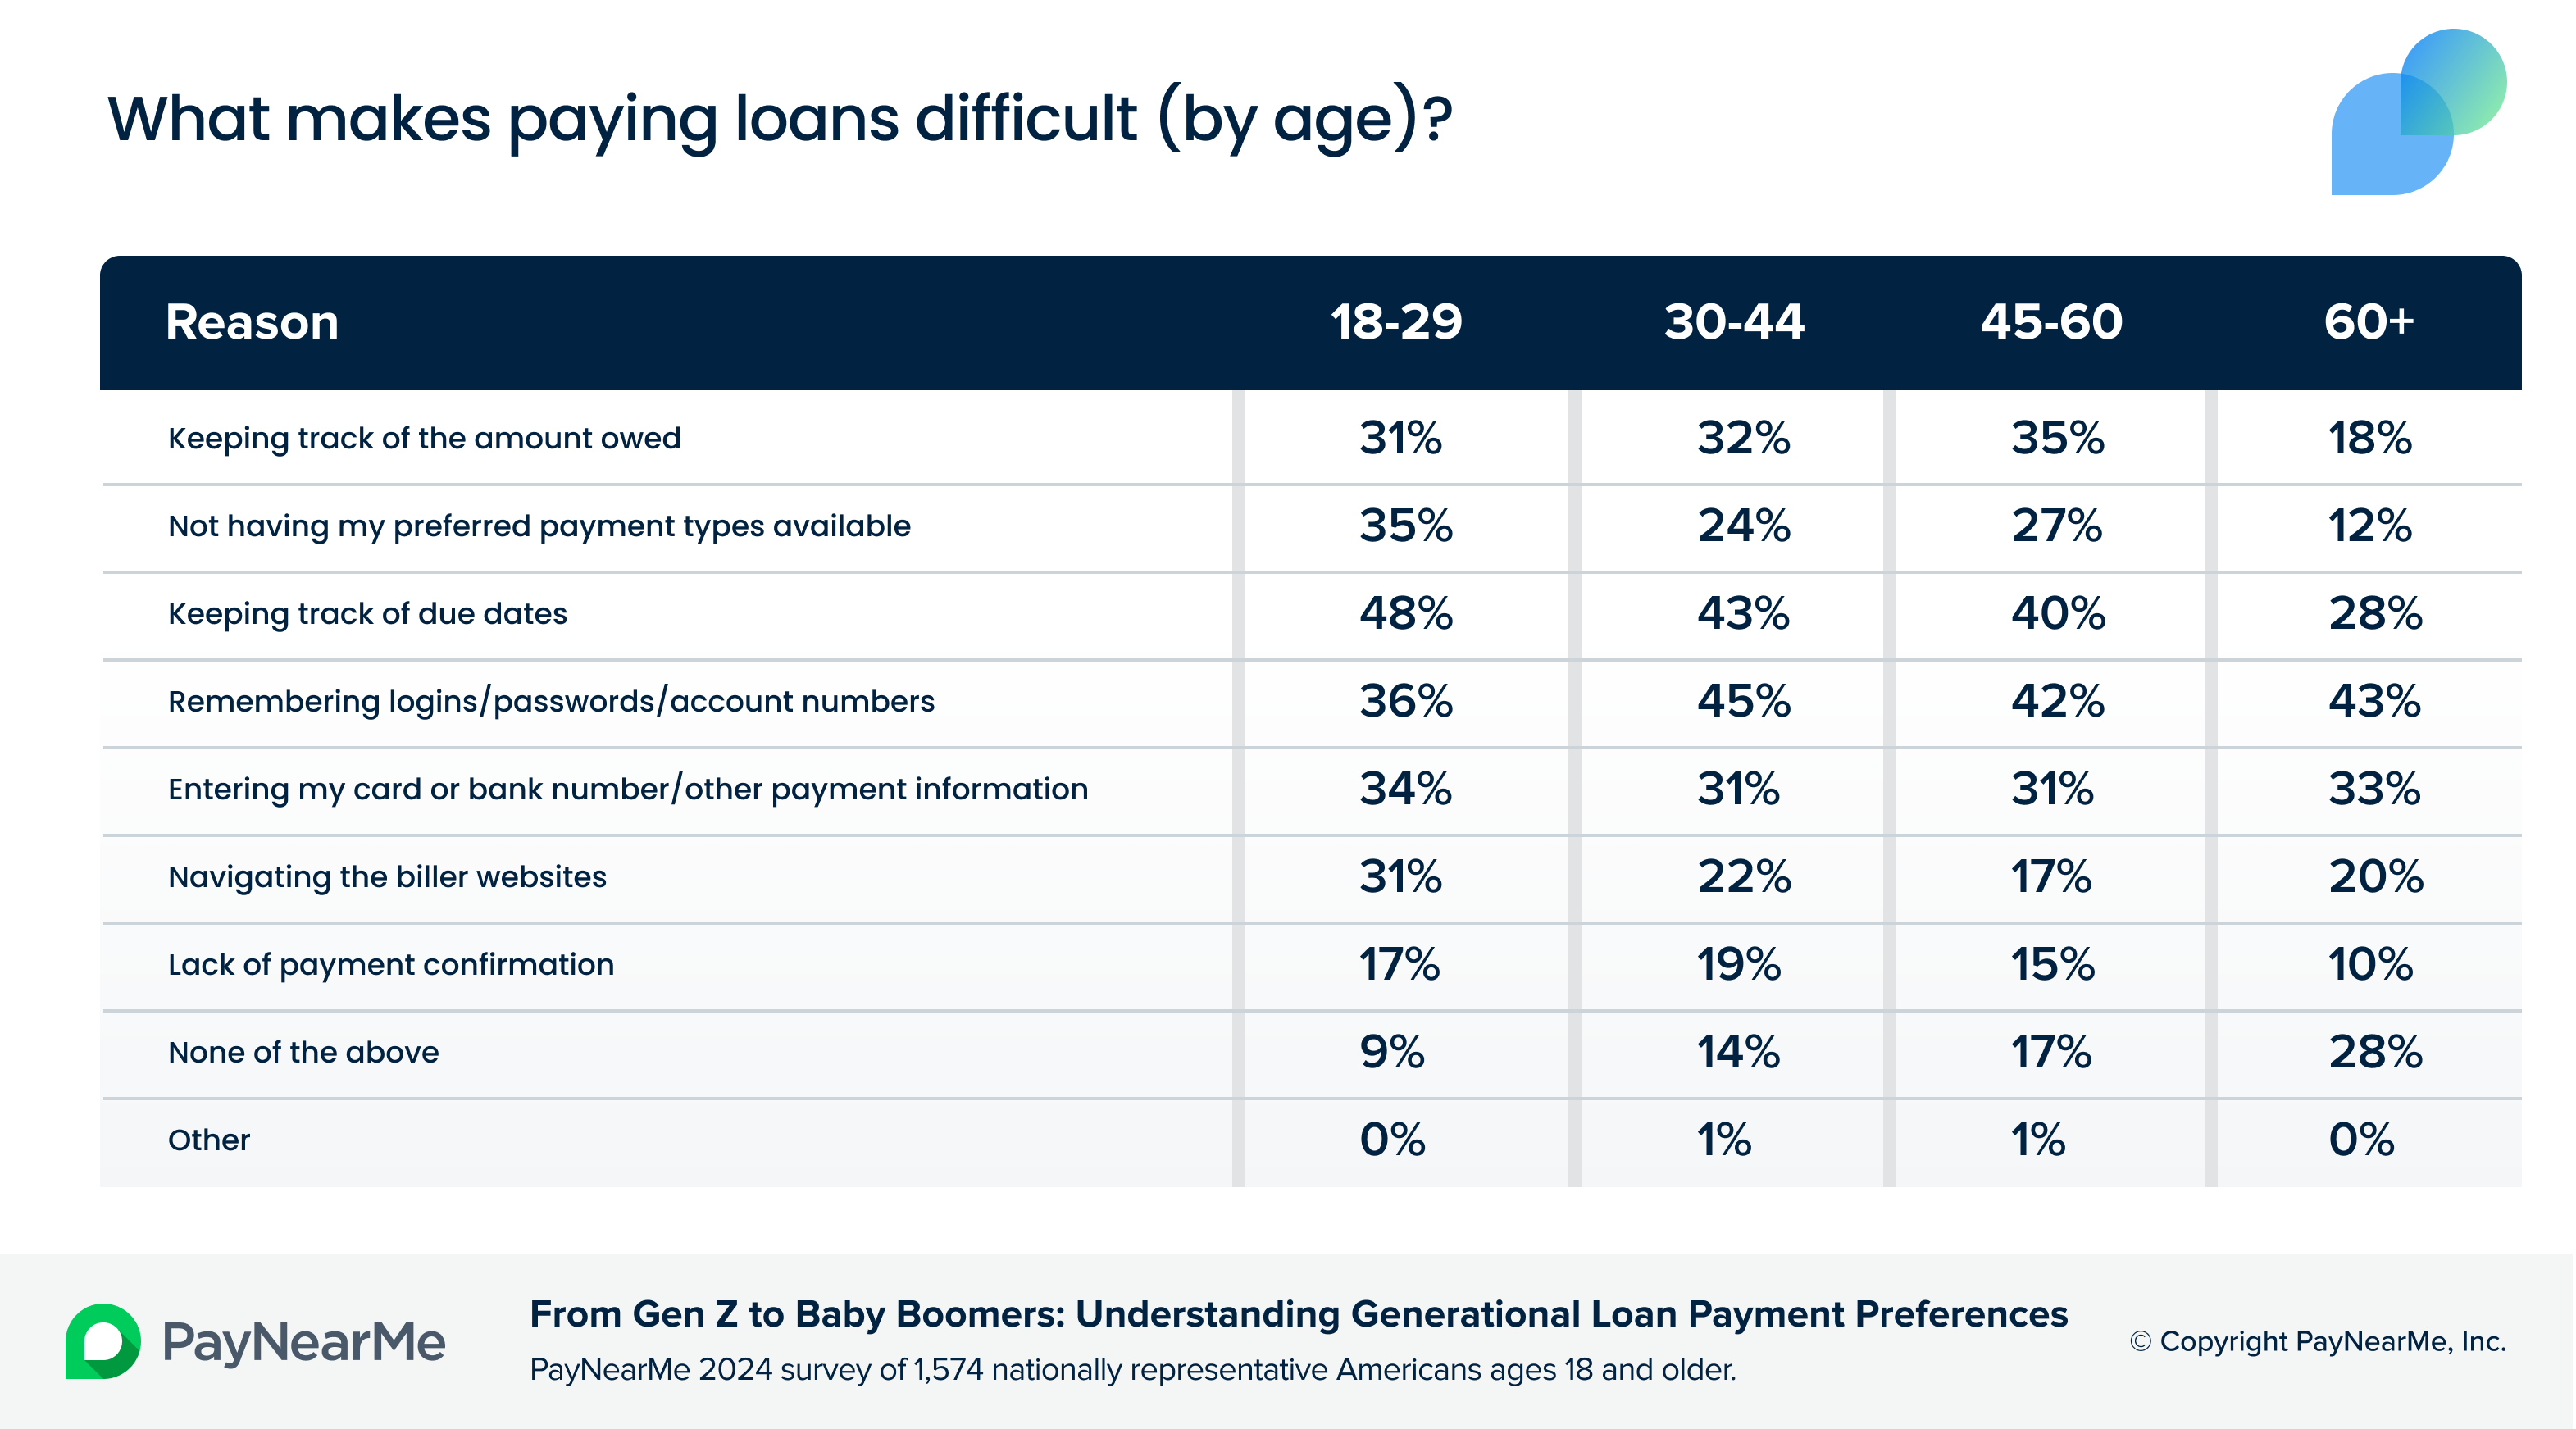 What makes loan payment difficult (by age)
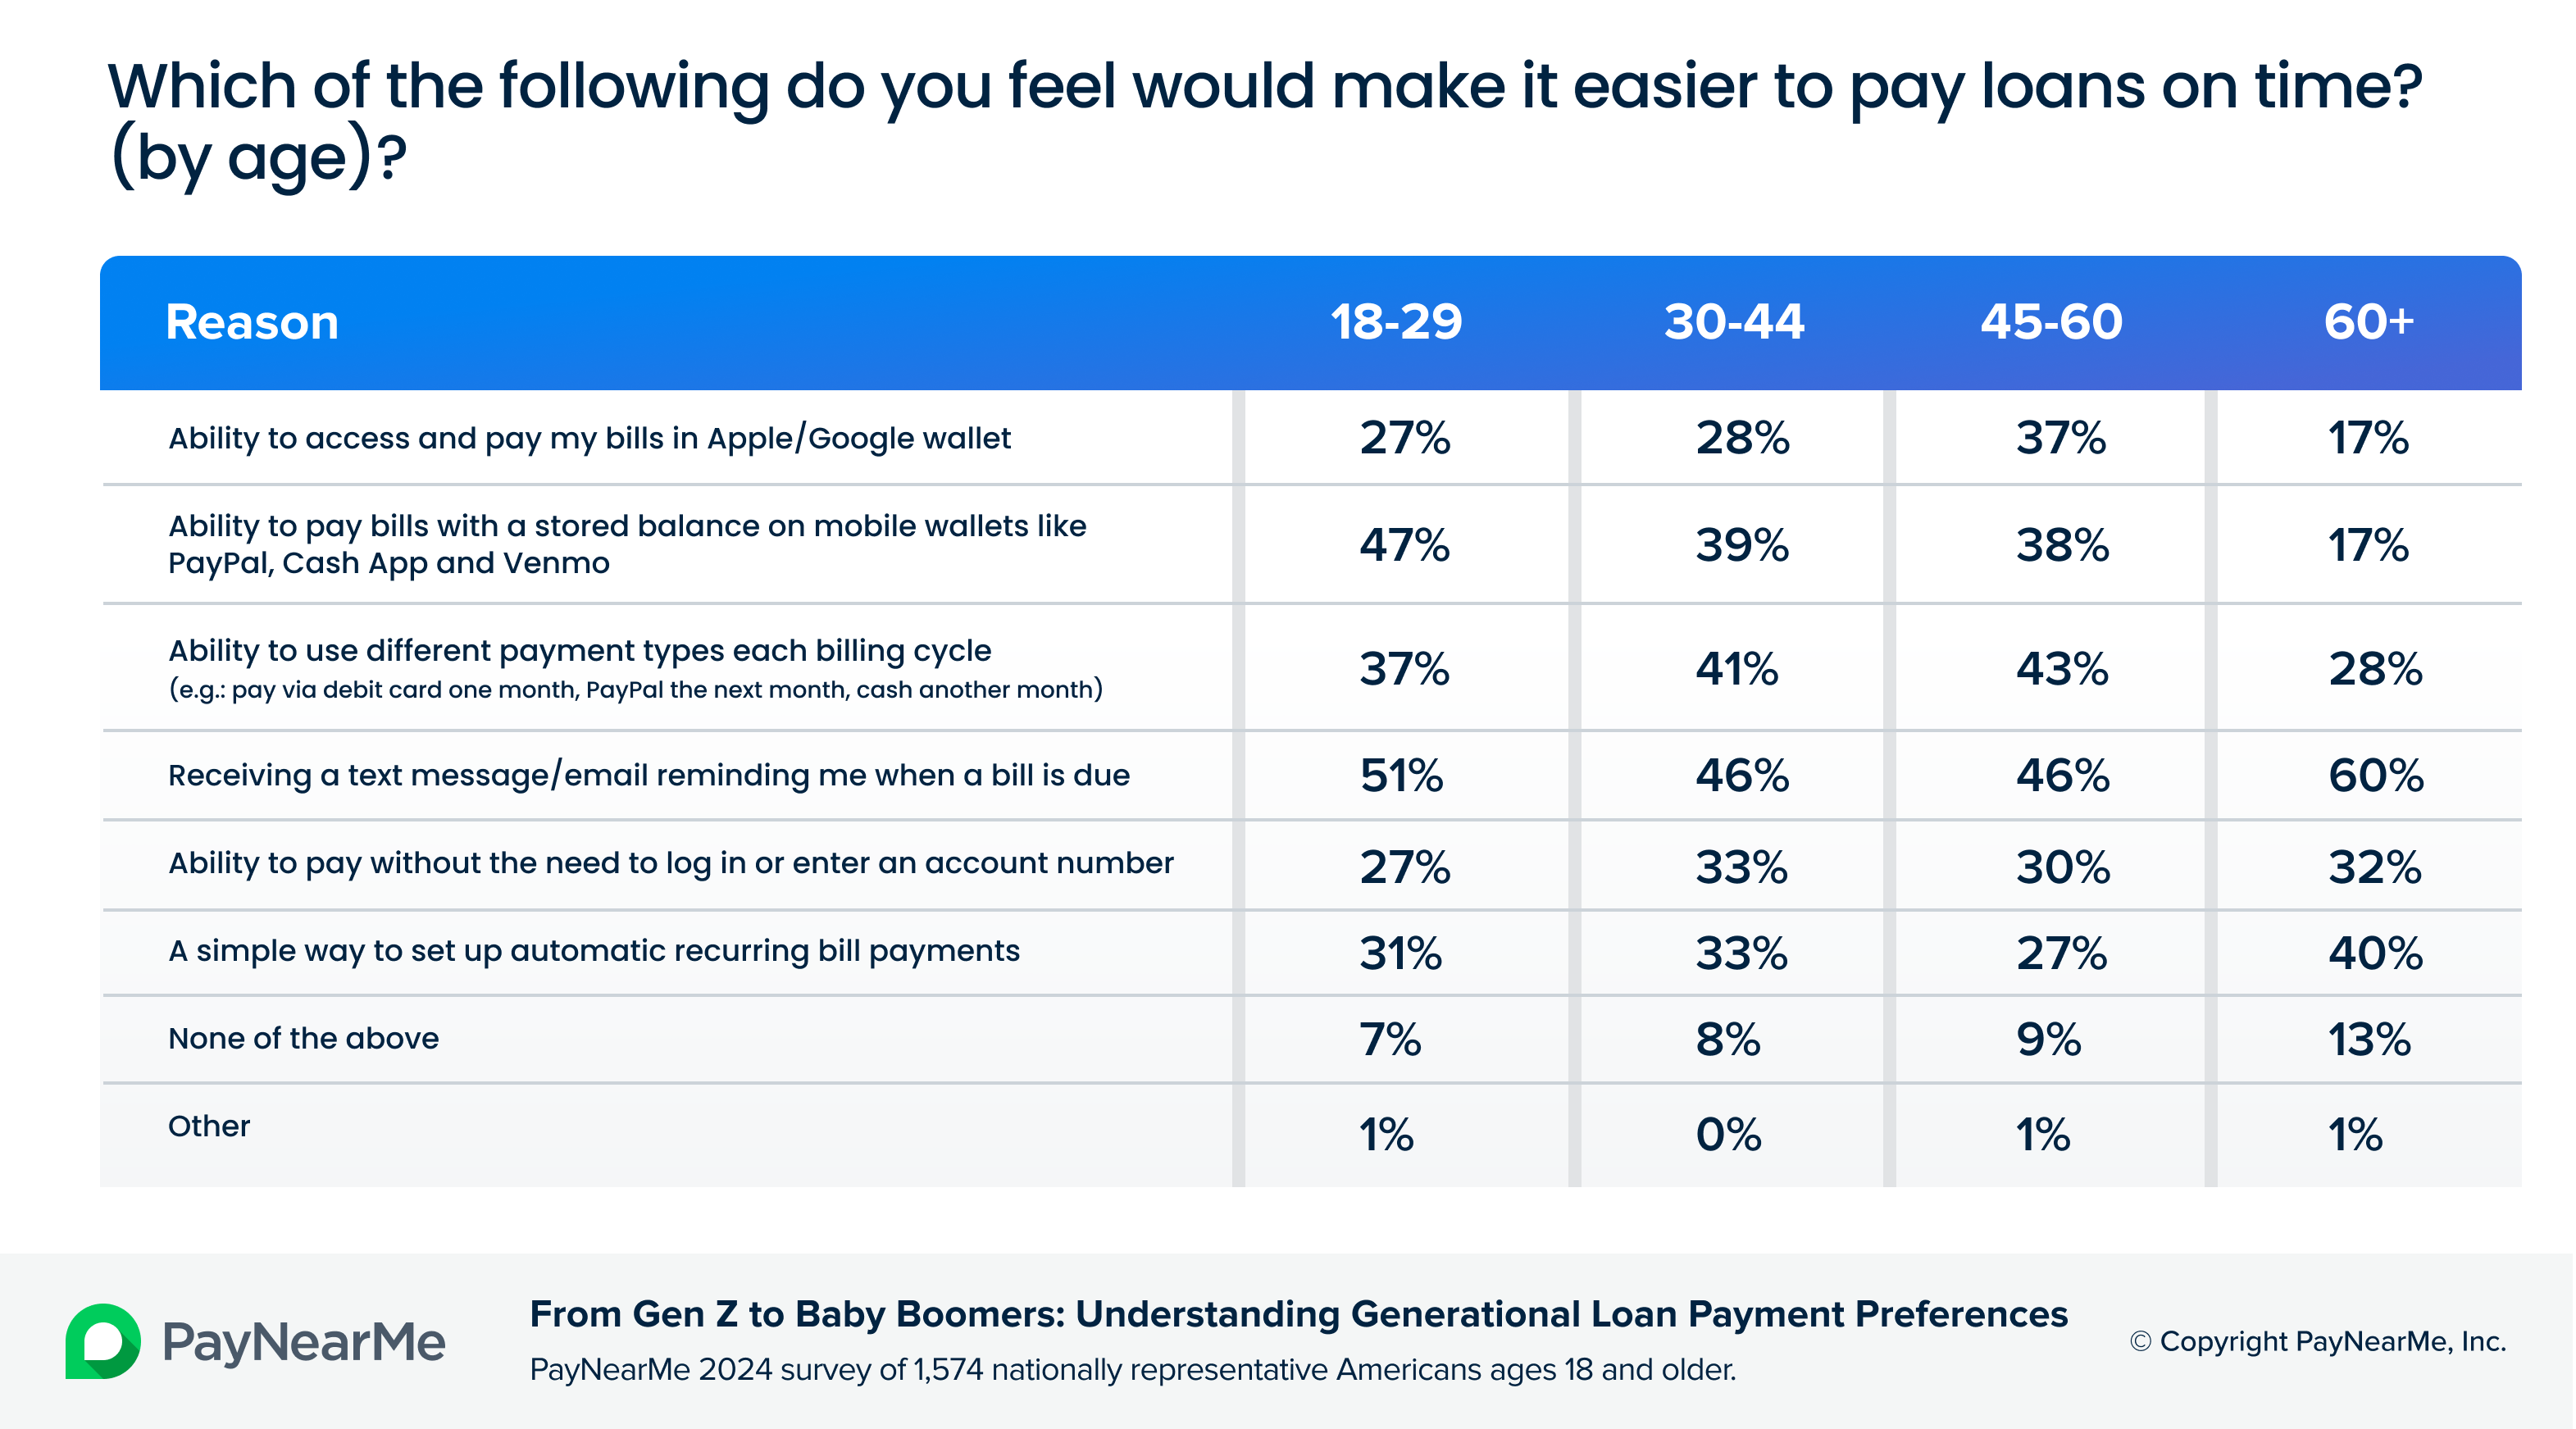 What would make payment easier (by age)
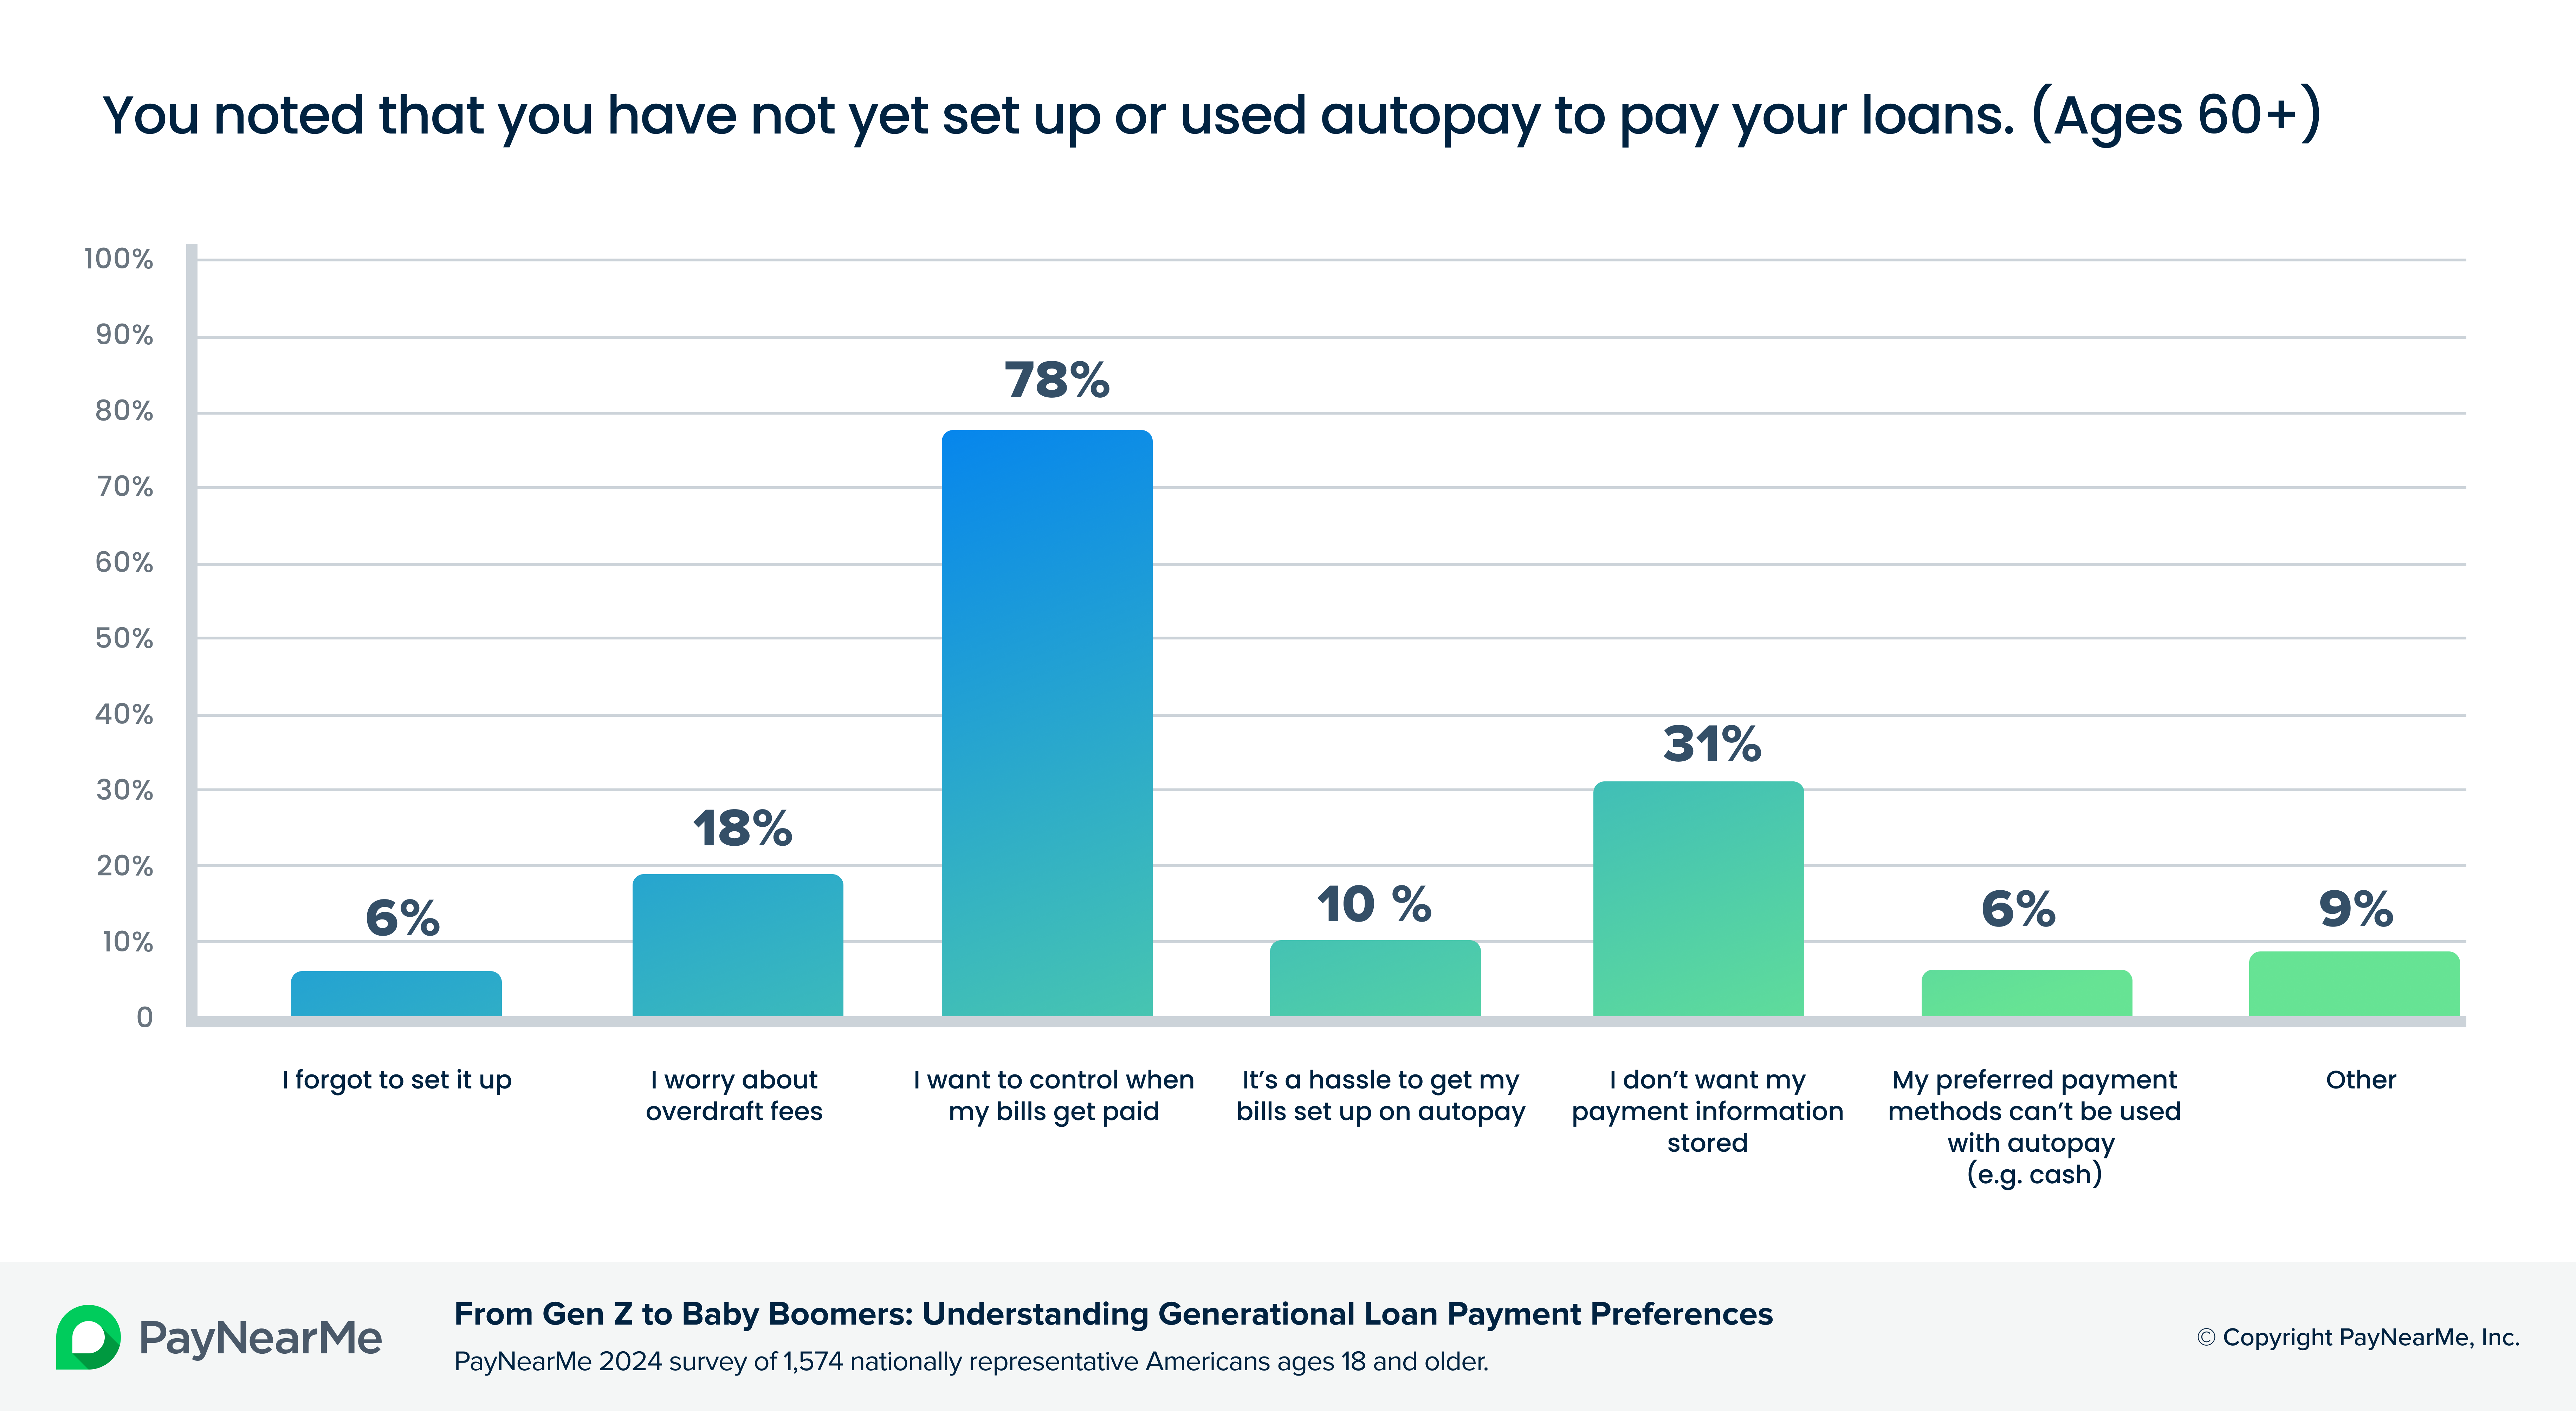 Why haven't you set up autopay (ages 60+)
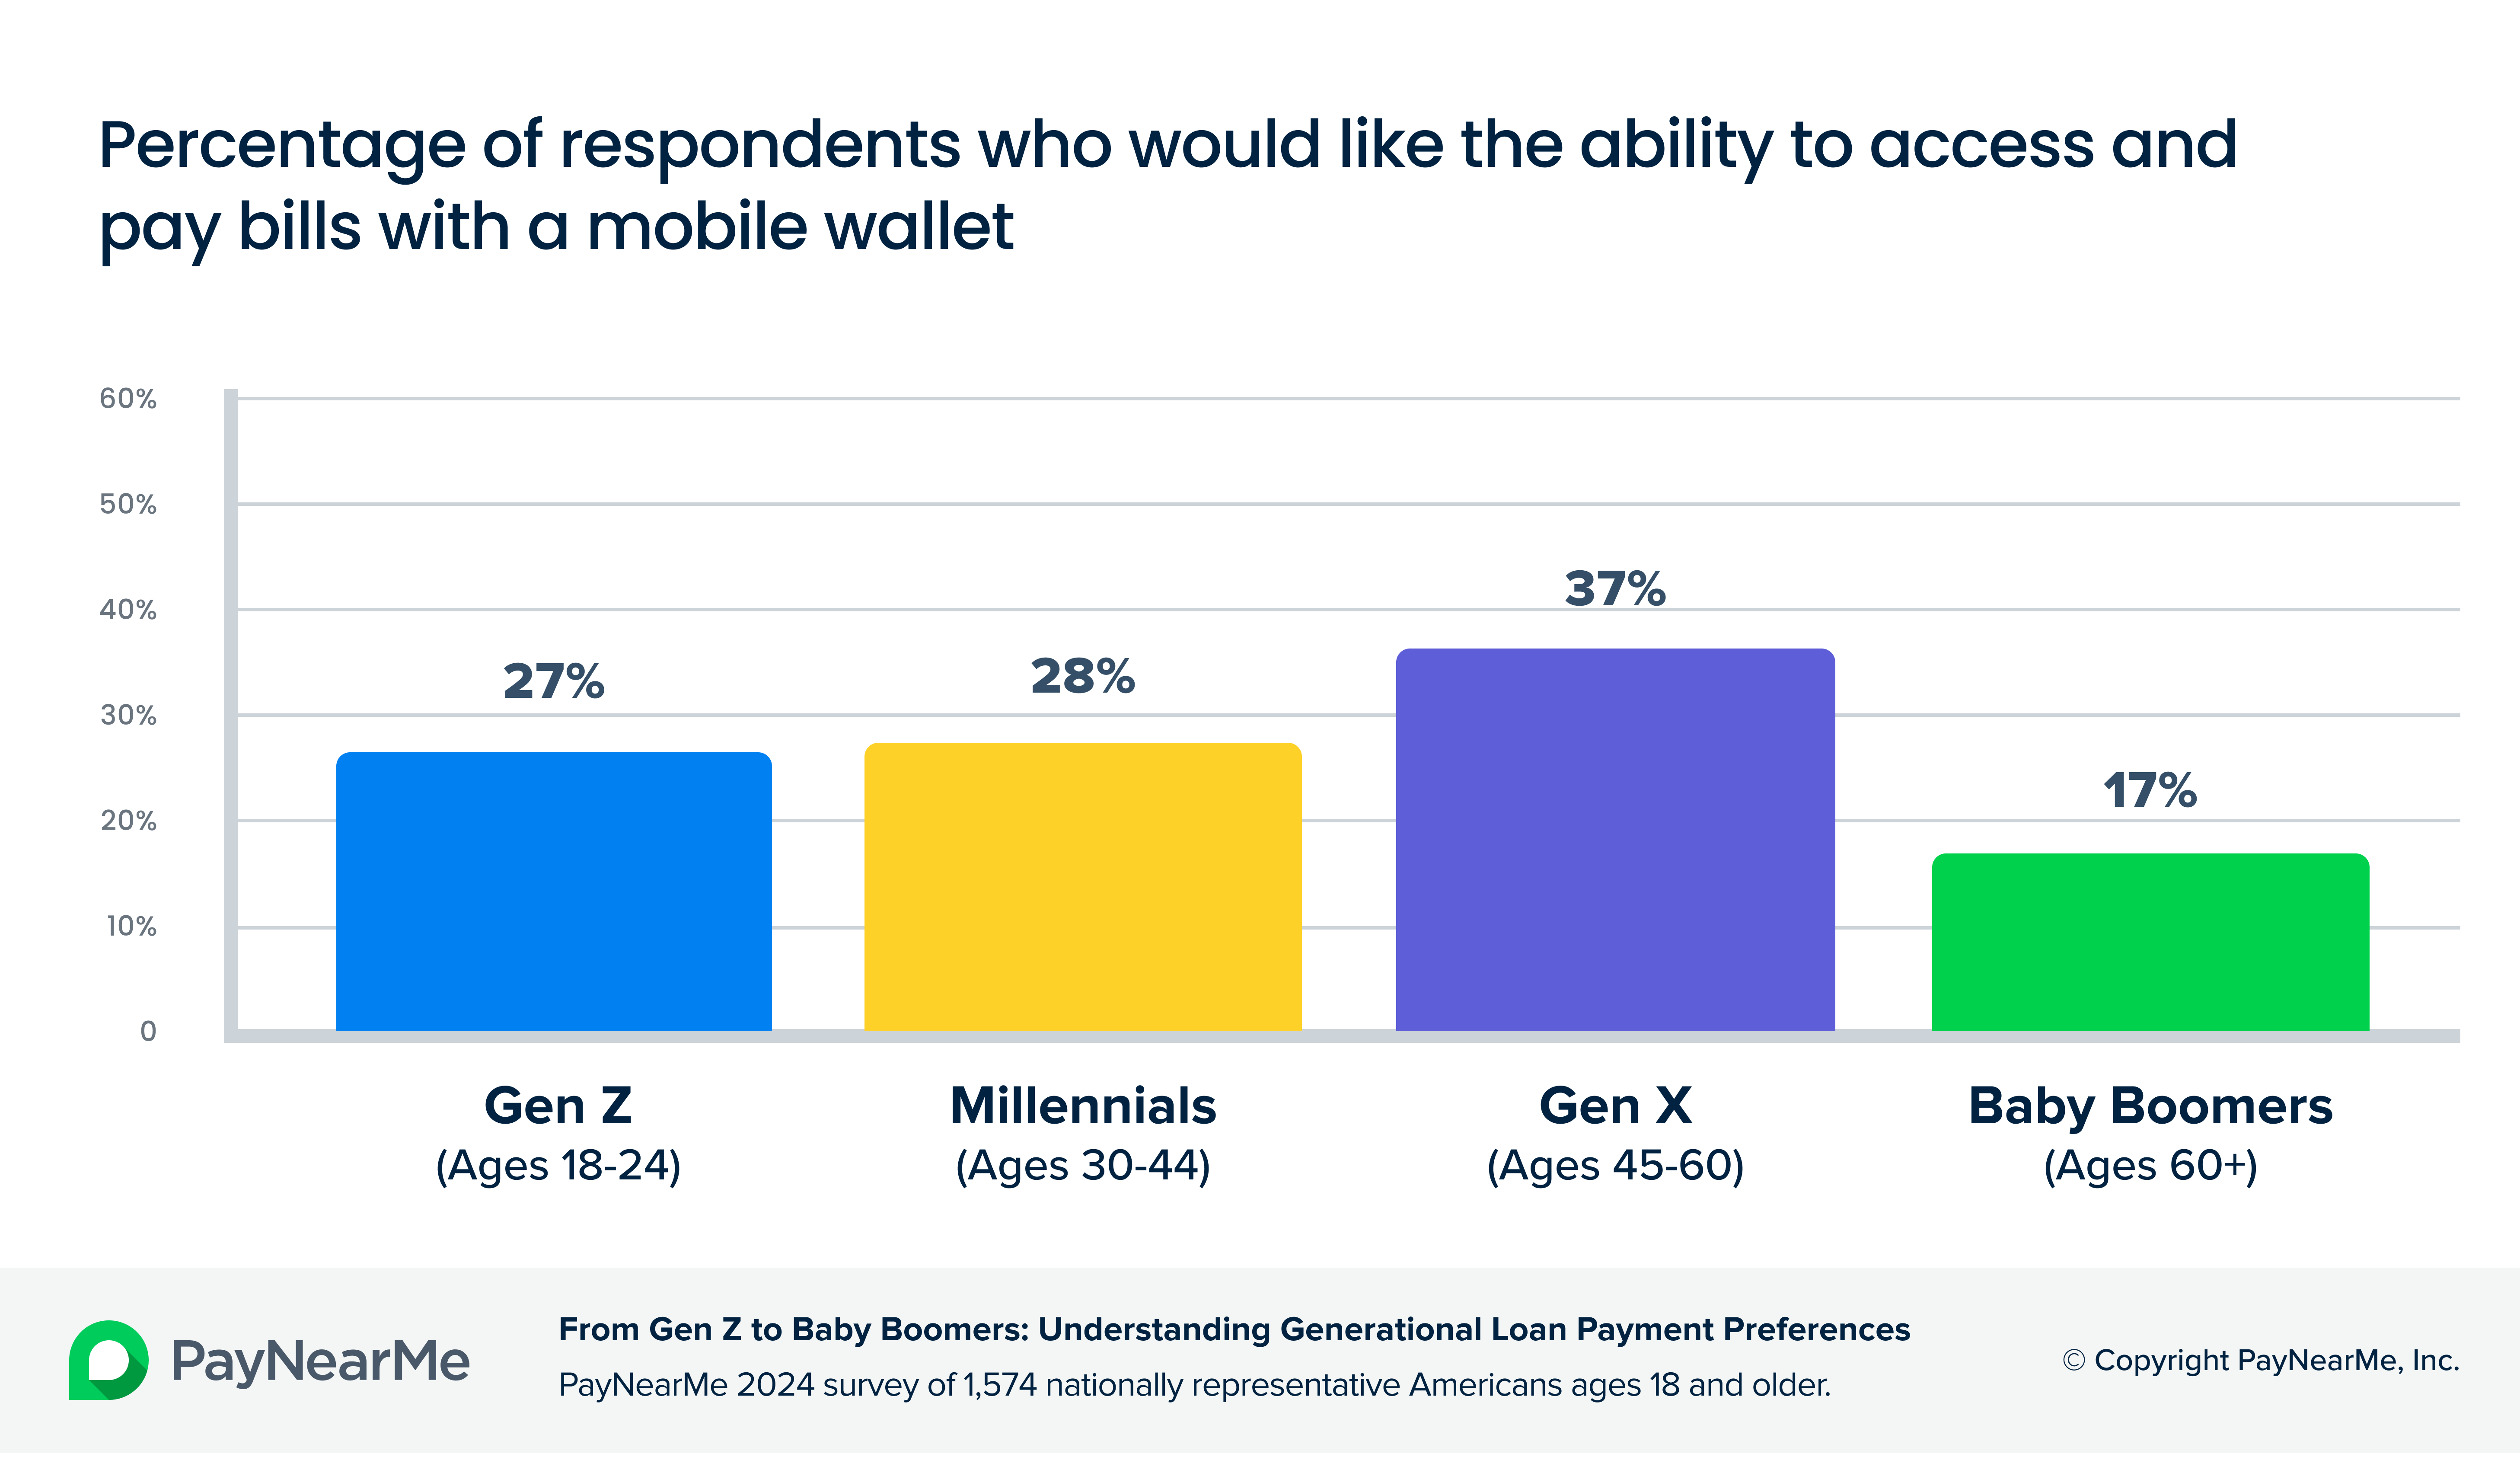 Desire for mobile wallet payments (by age)
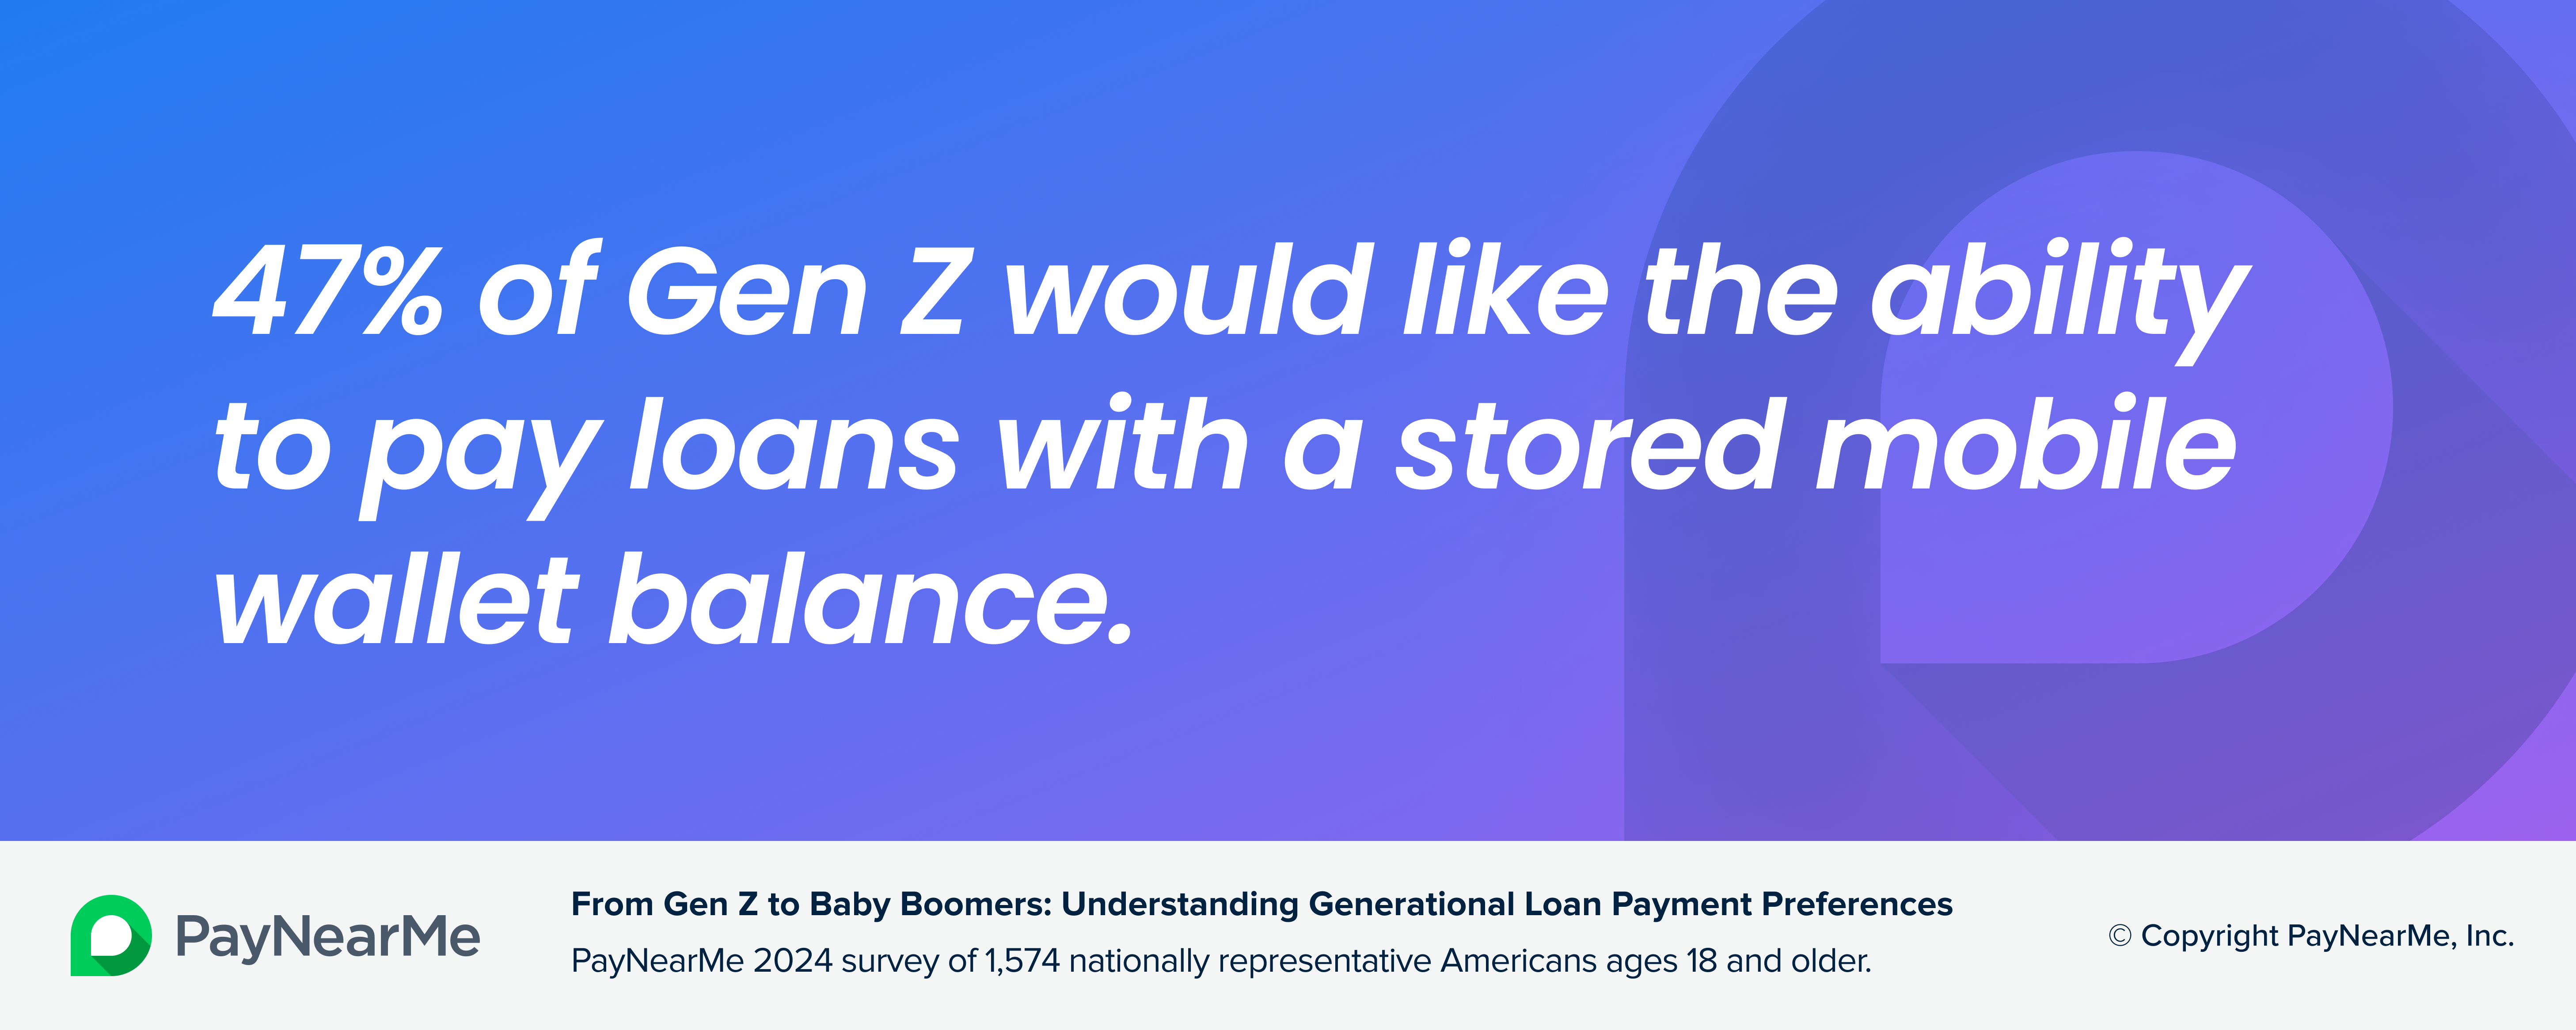 Gen Z desire for mobile wallet payments
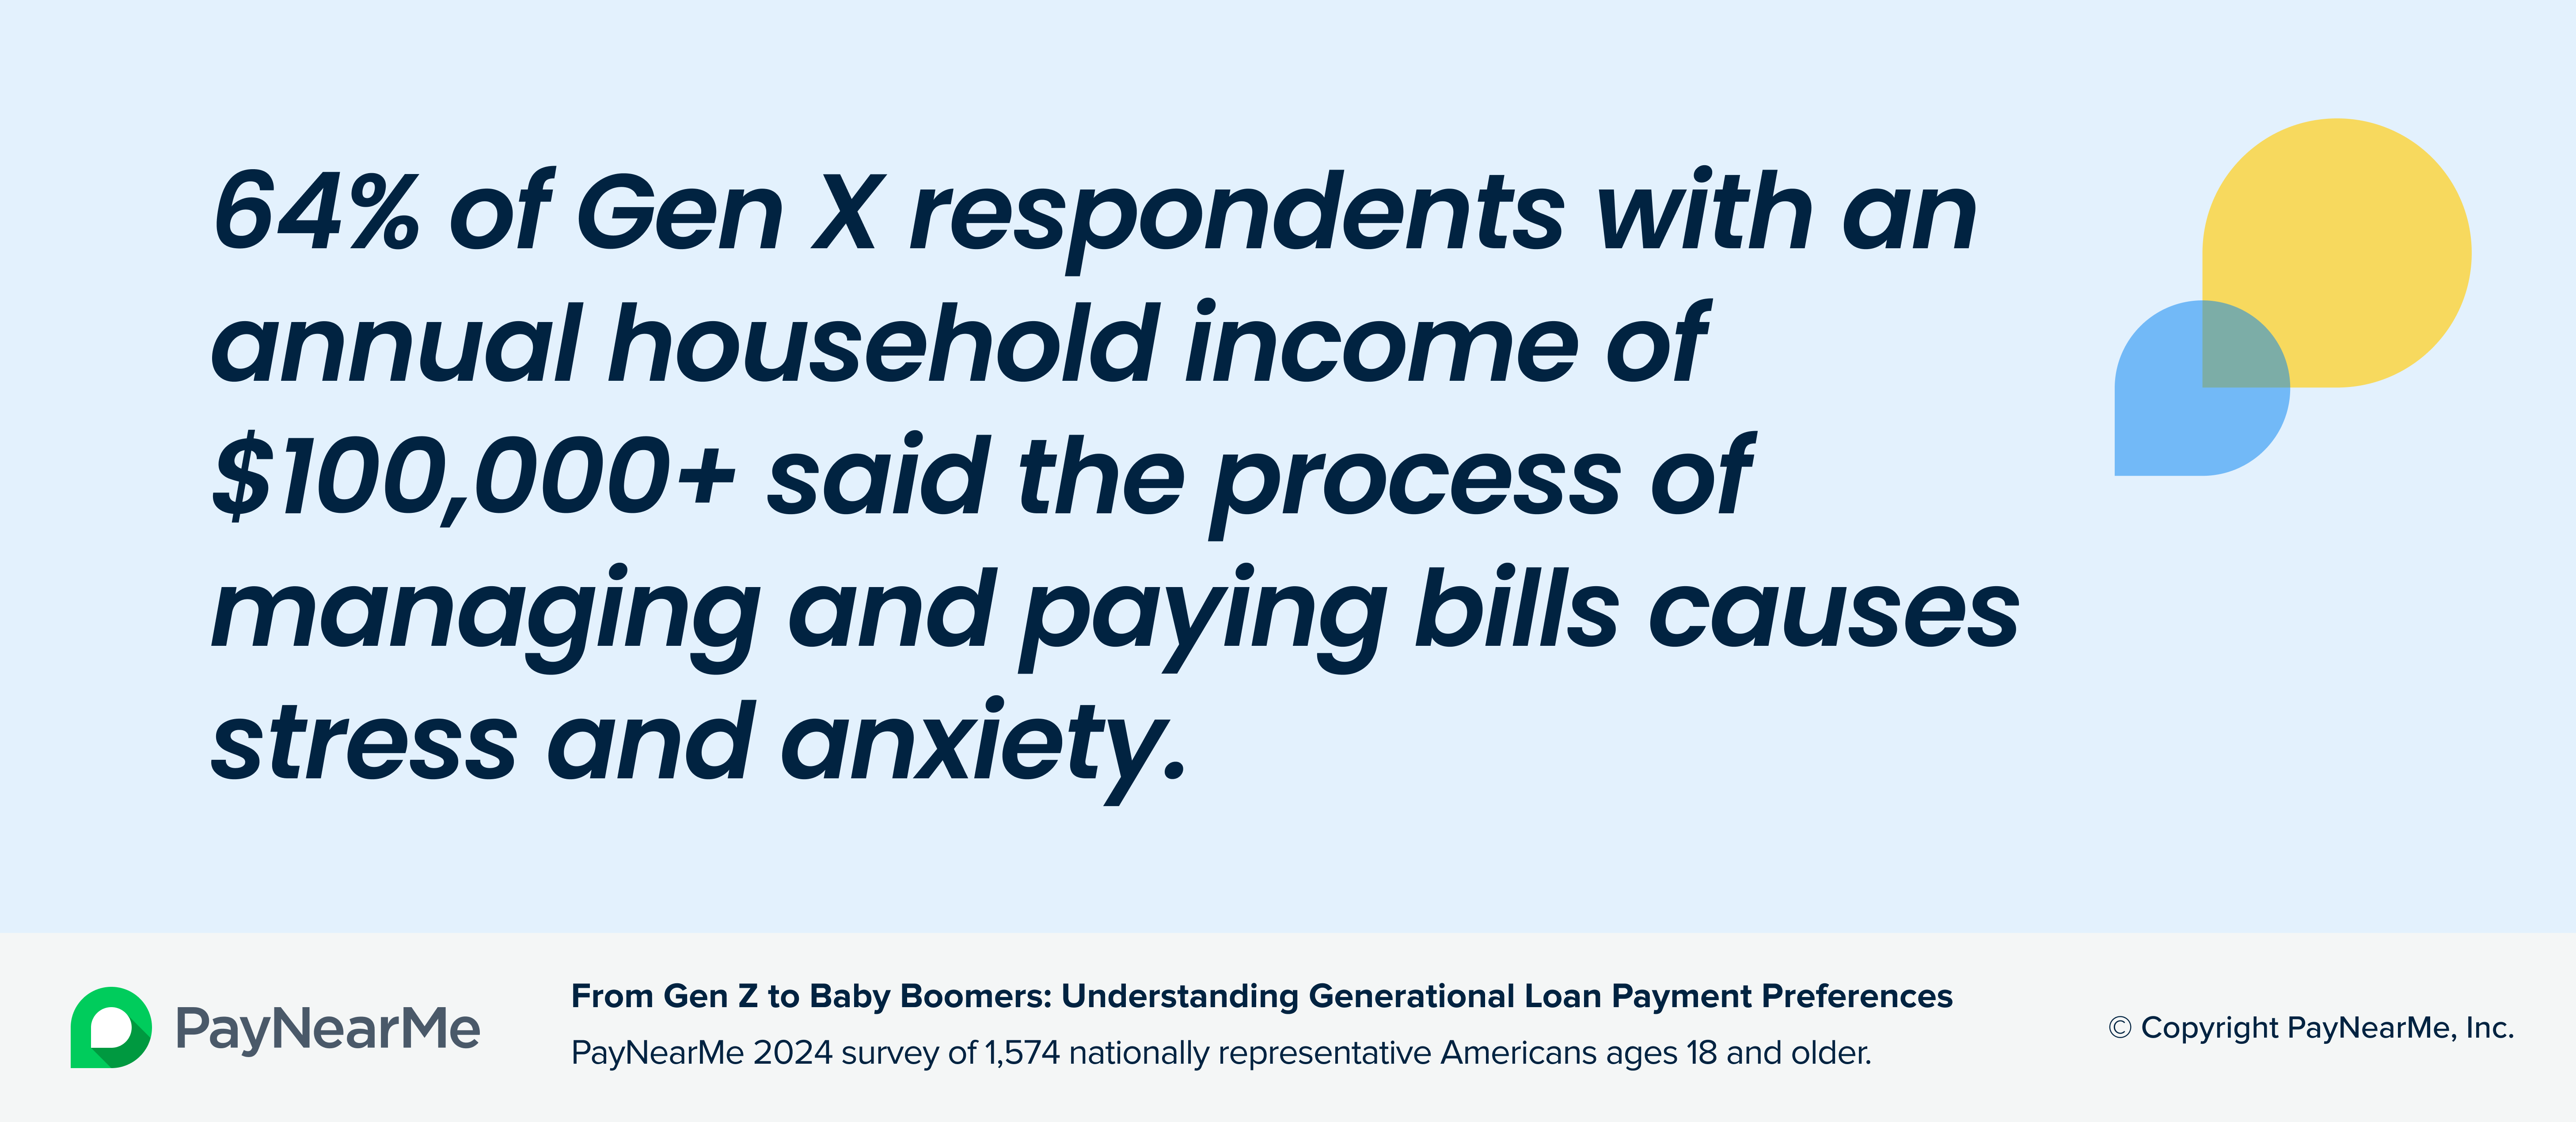 Bill pay stress and anxiety - Gen Z
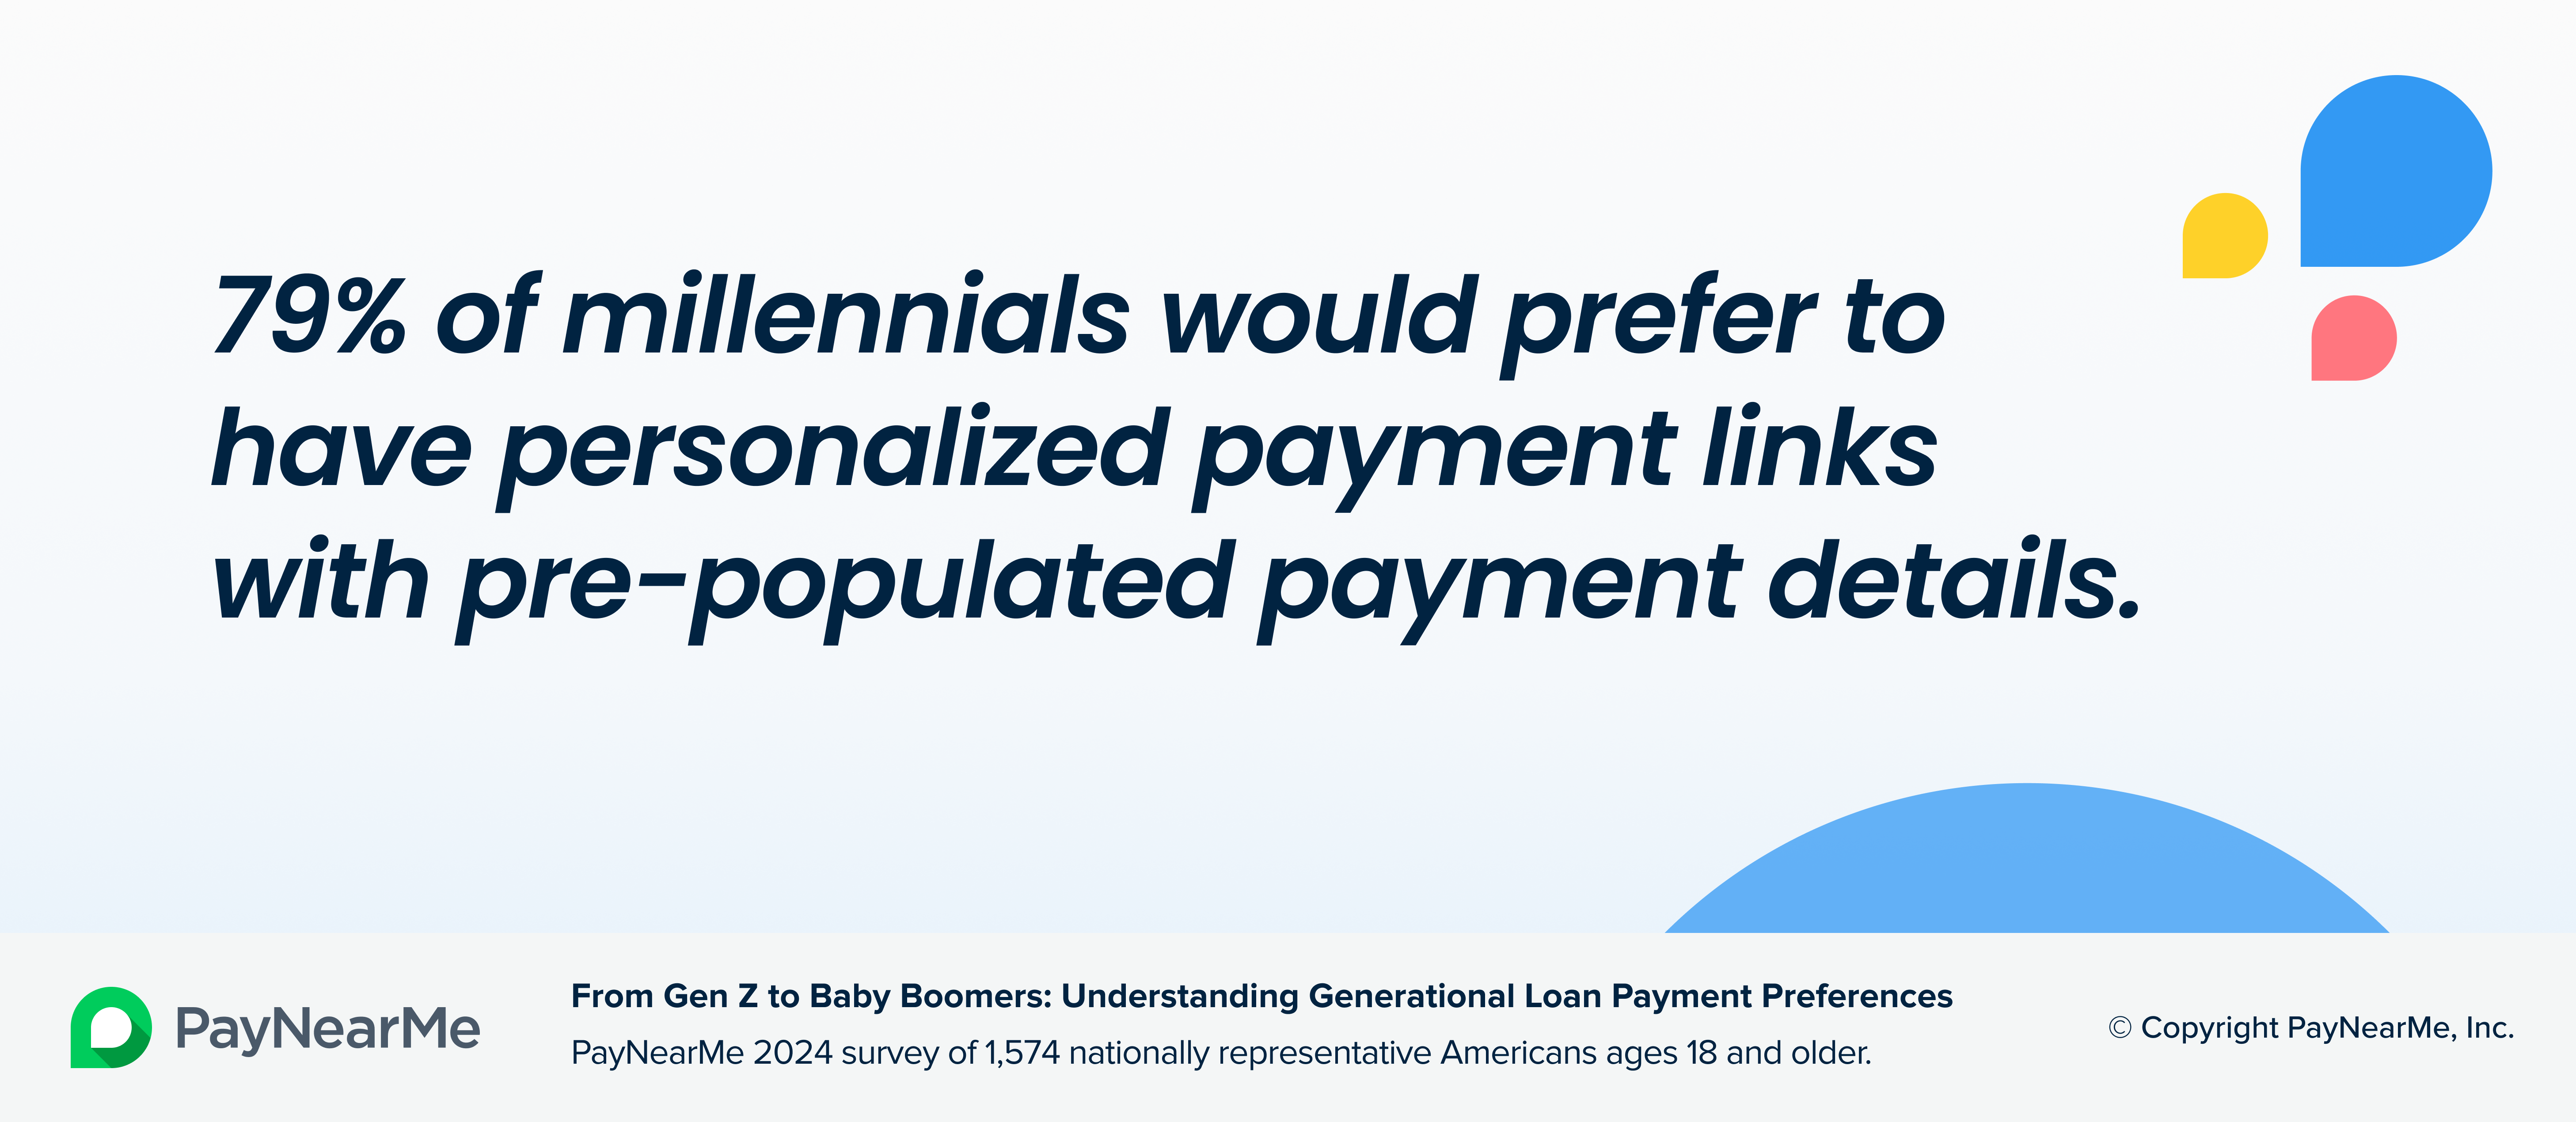 Millennials' personalized link preference
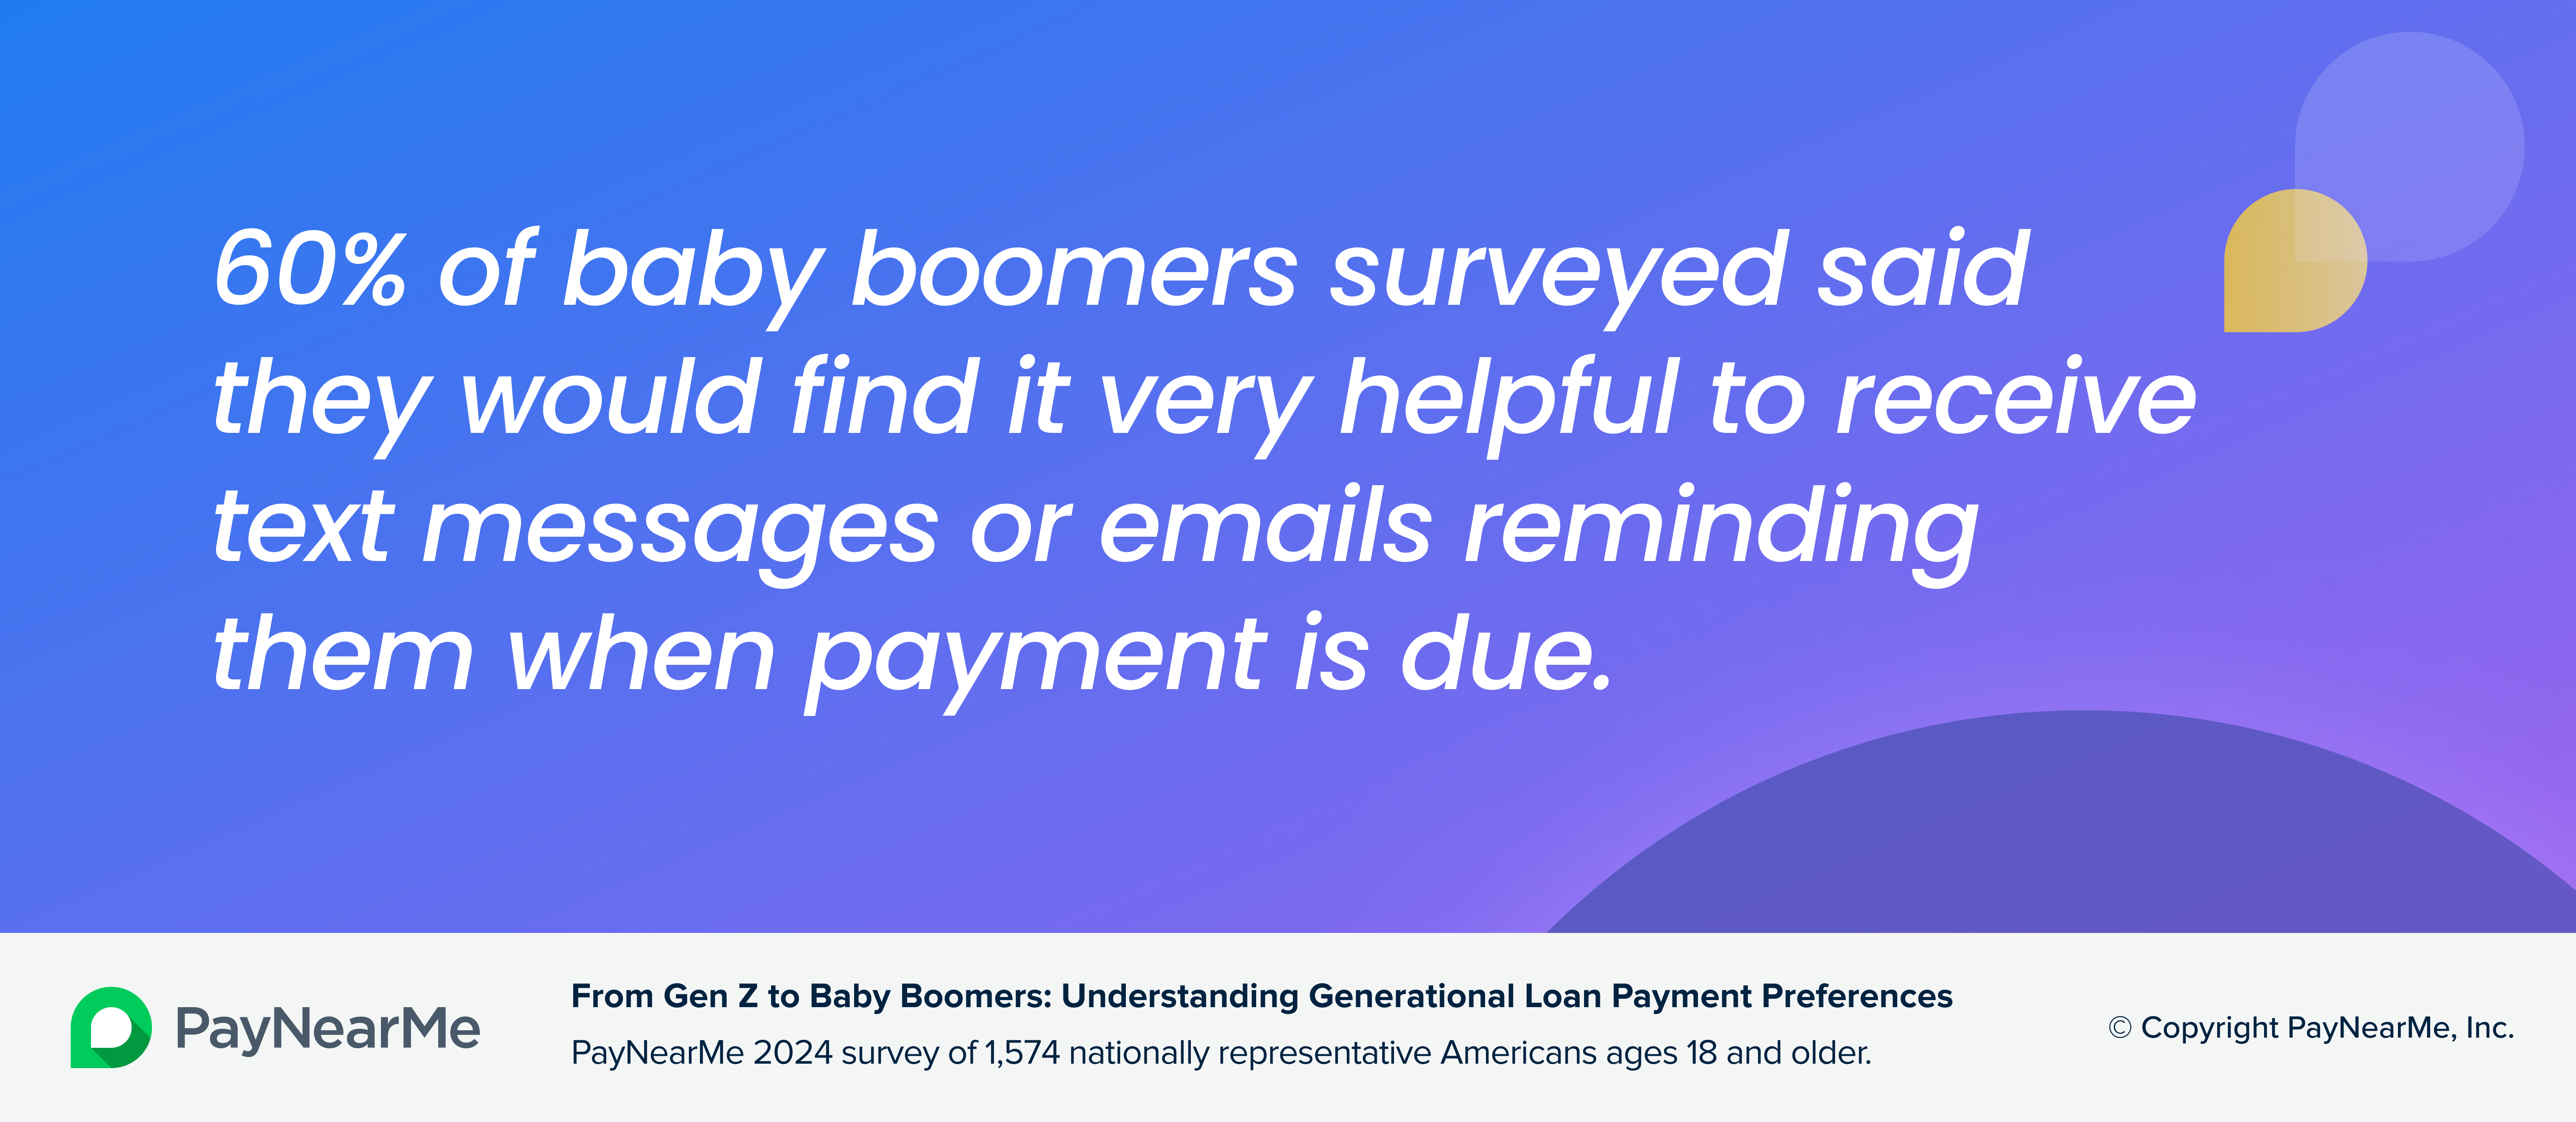 Payment reminders - Baby boomers
Consumer Trends Driving the Future of Loan Payments
This report explores how consumers repay loans and how important personalization and choice are to the overall payment experience.
 What makes paying loans difficult?
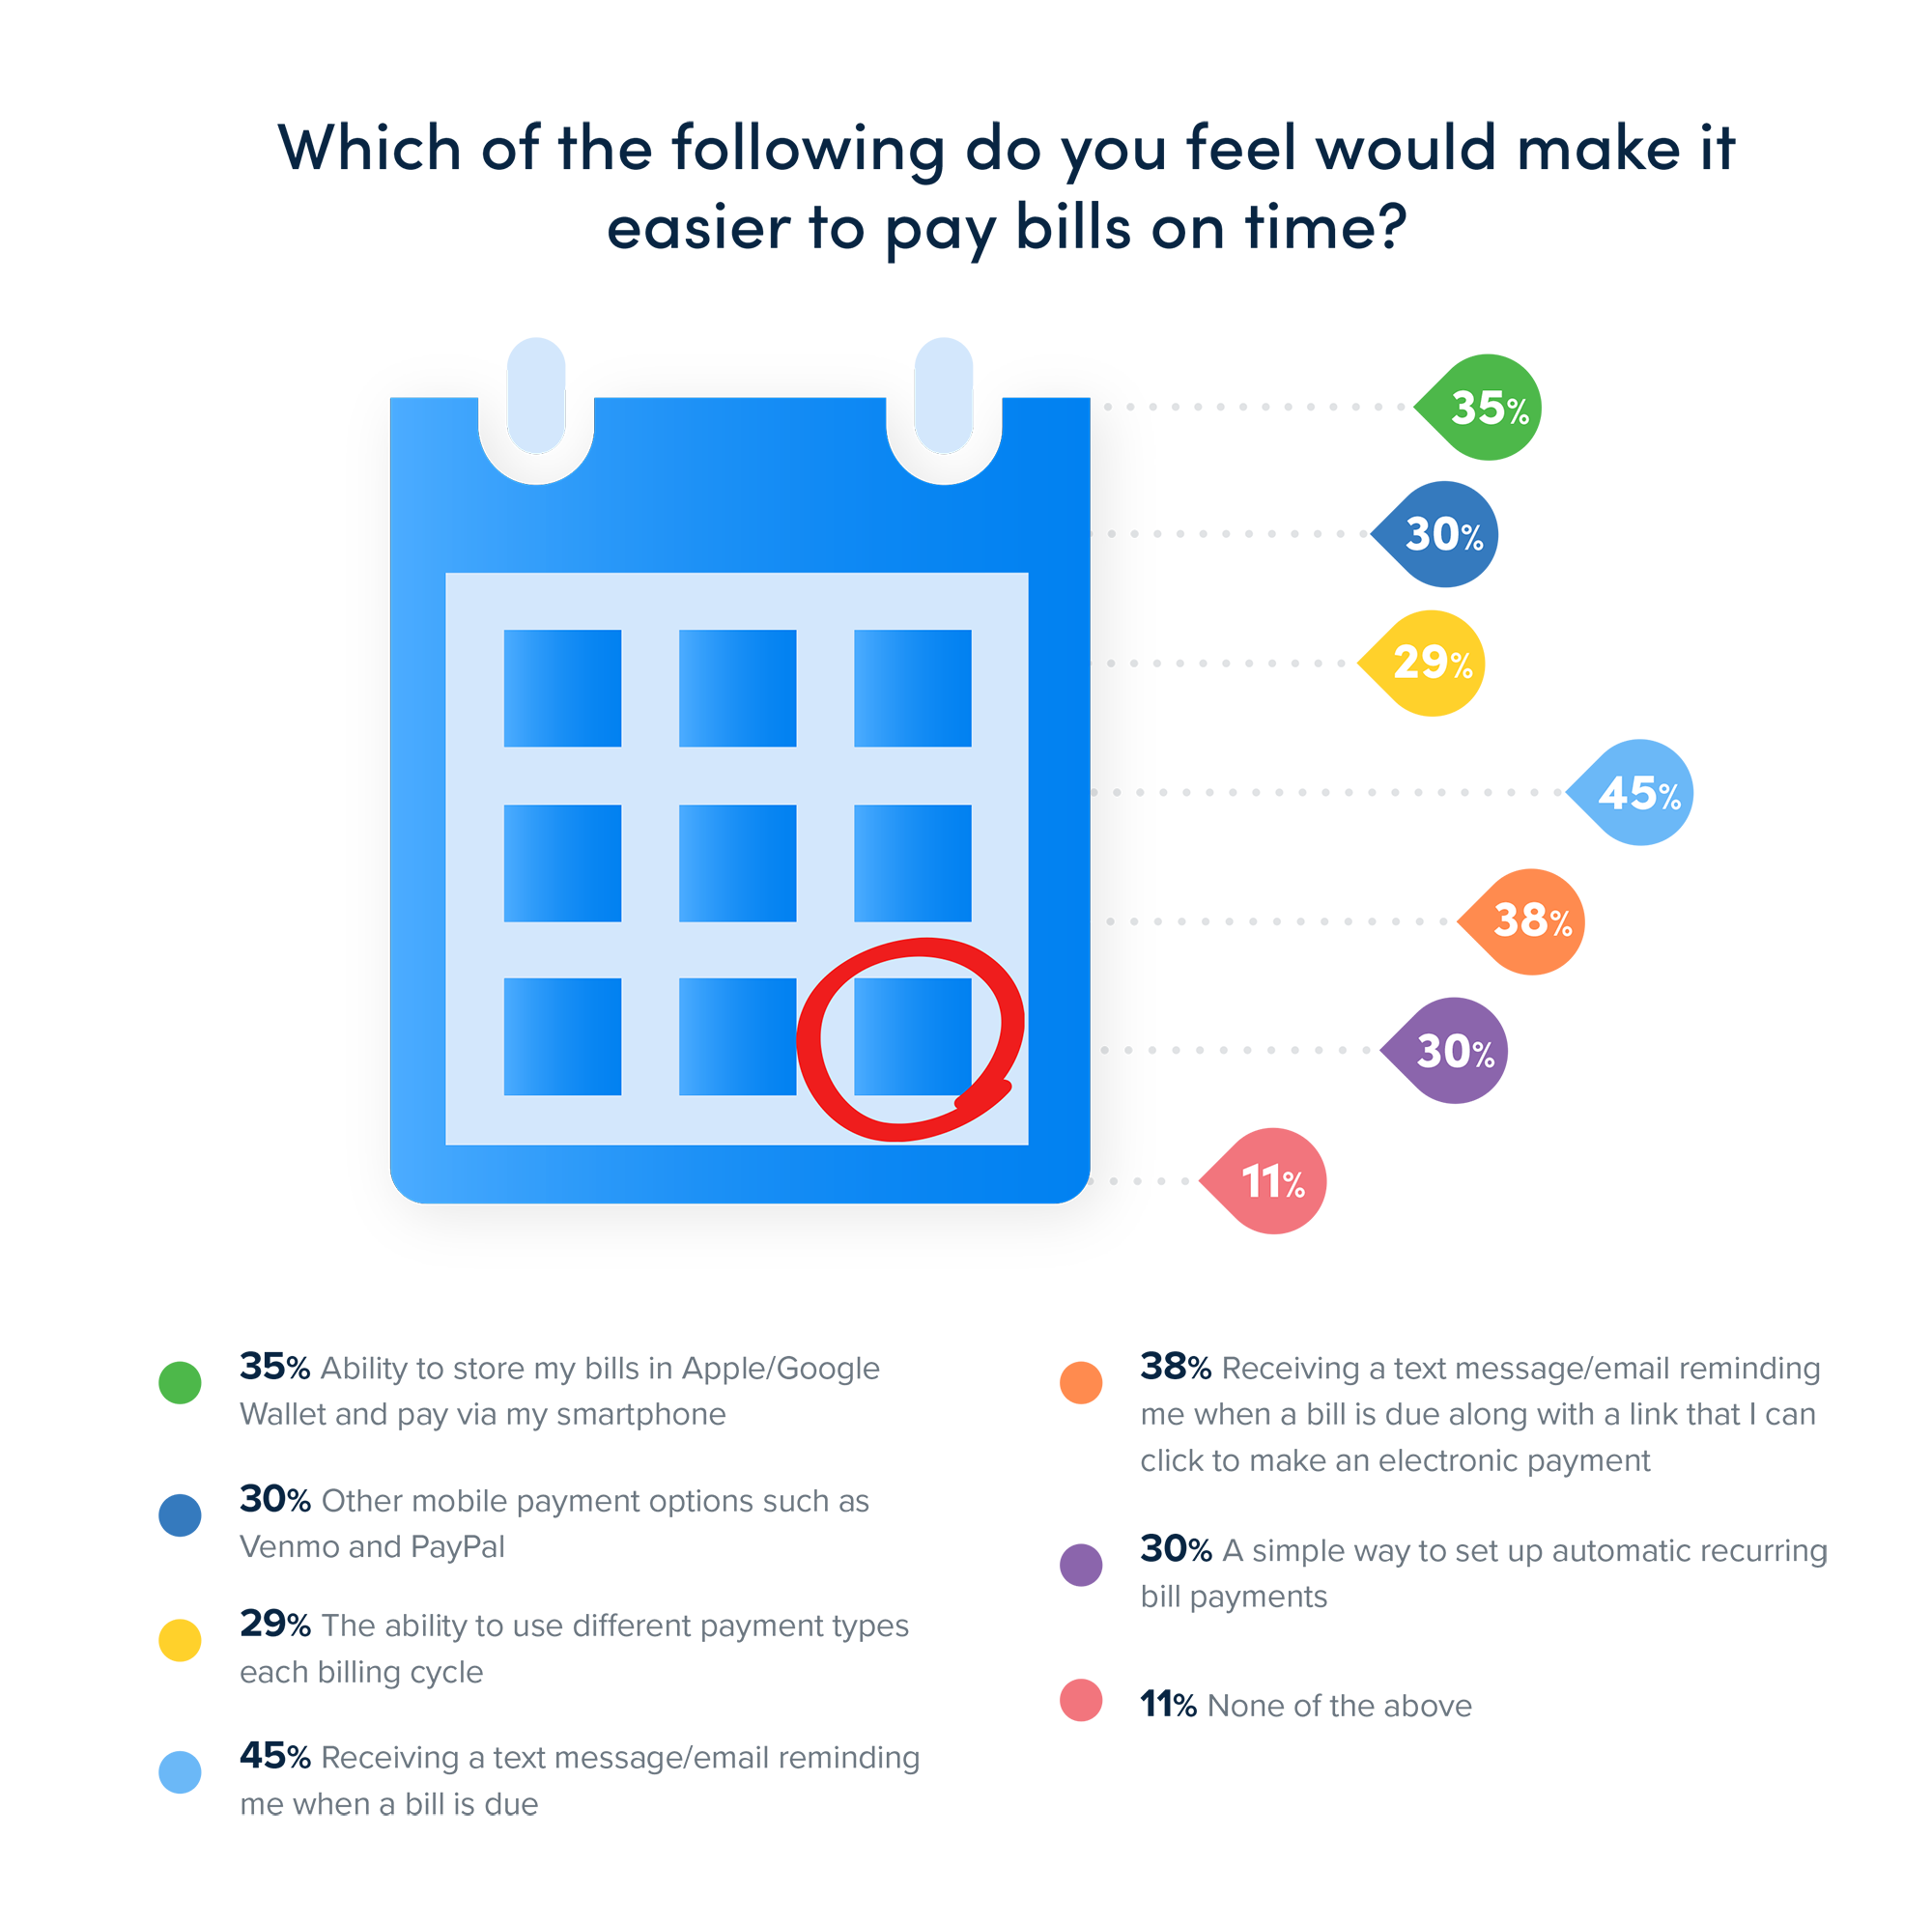
 What would make it easier for consumers to pay loans on time?
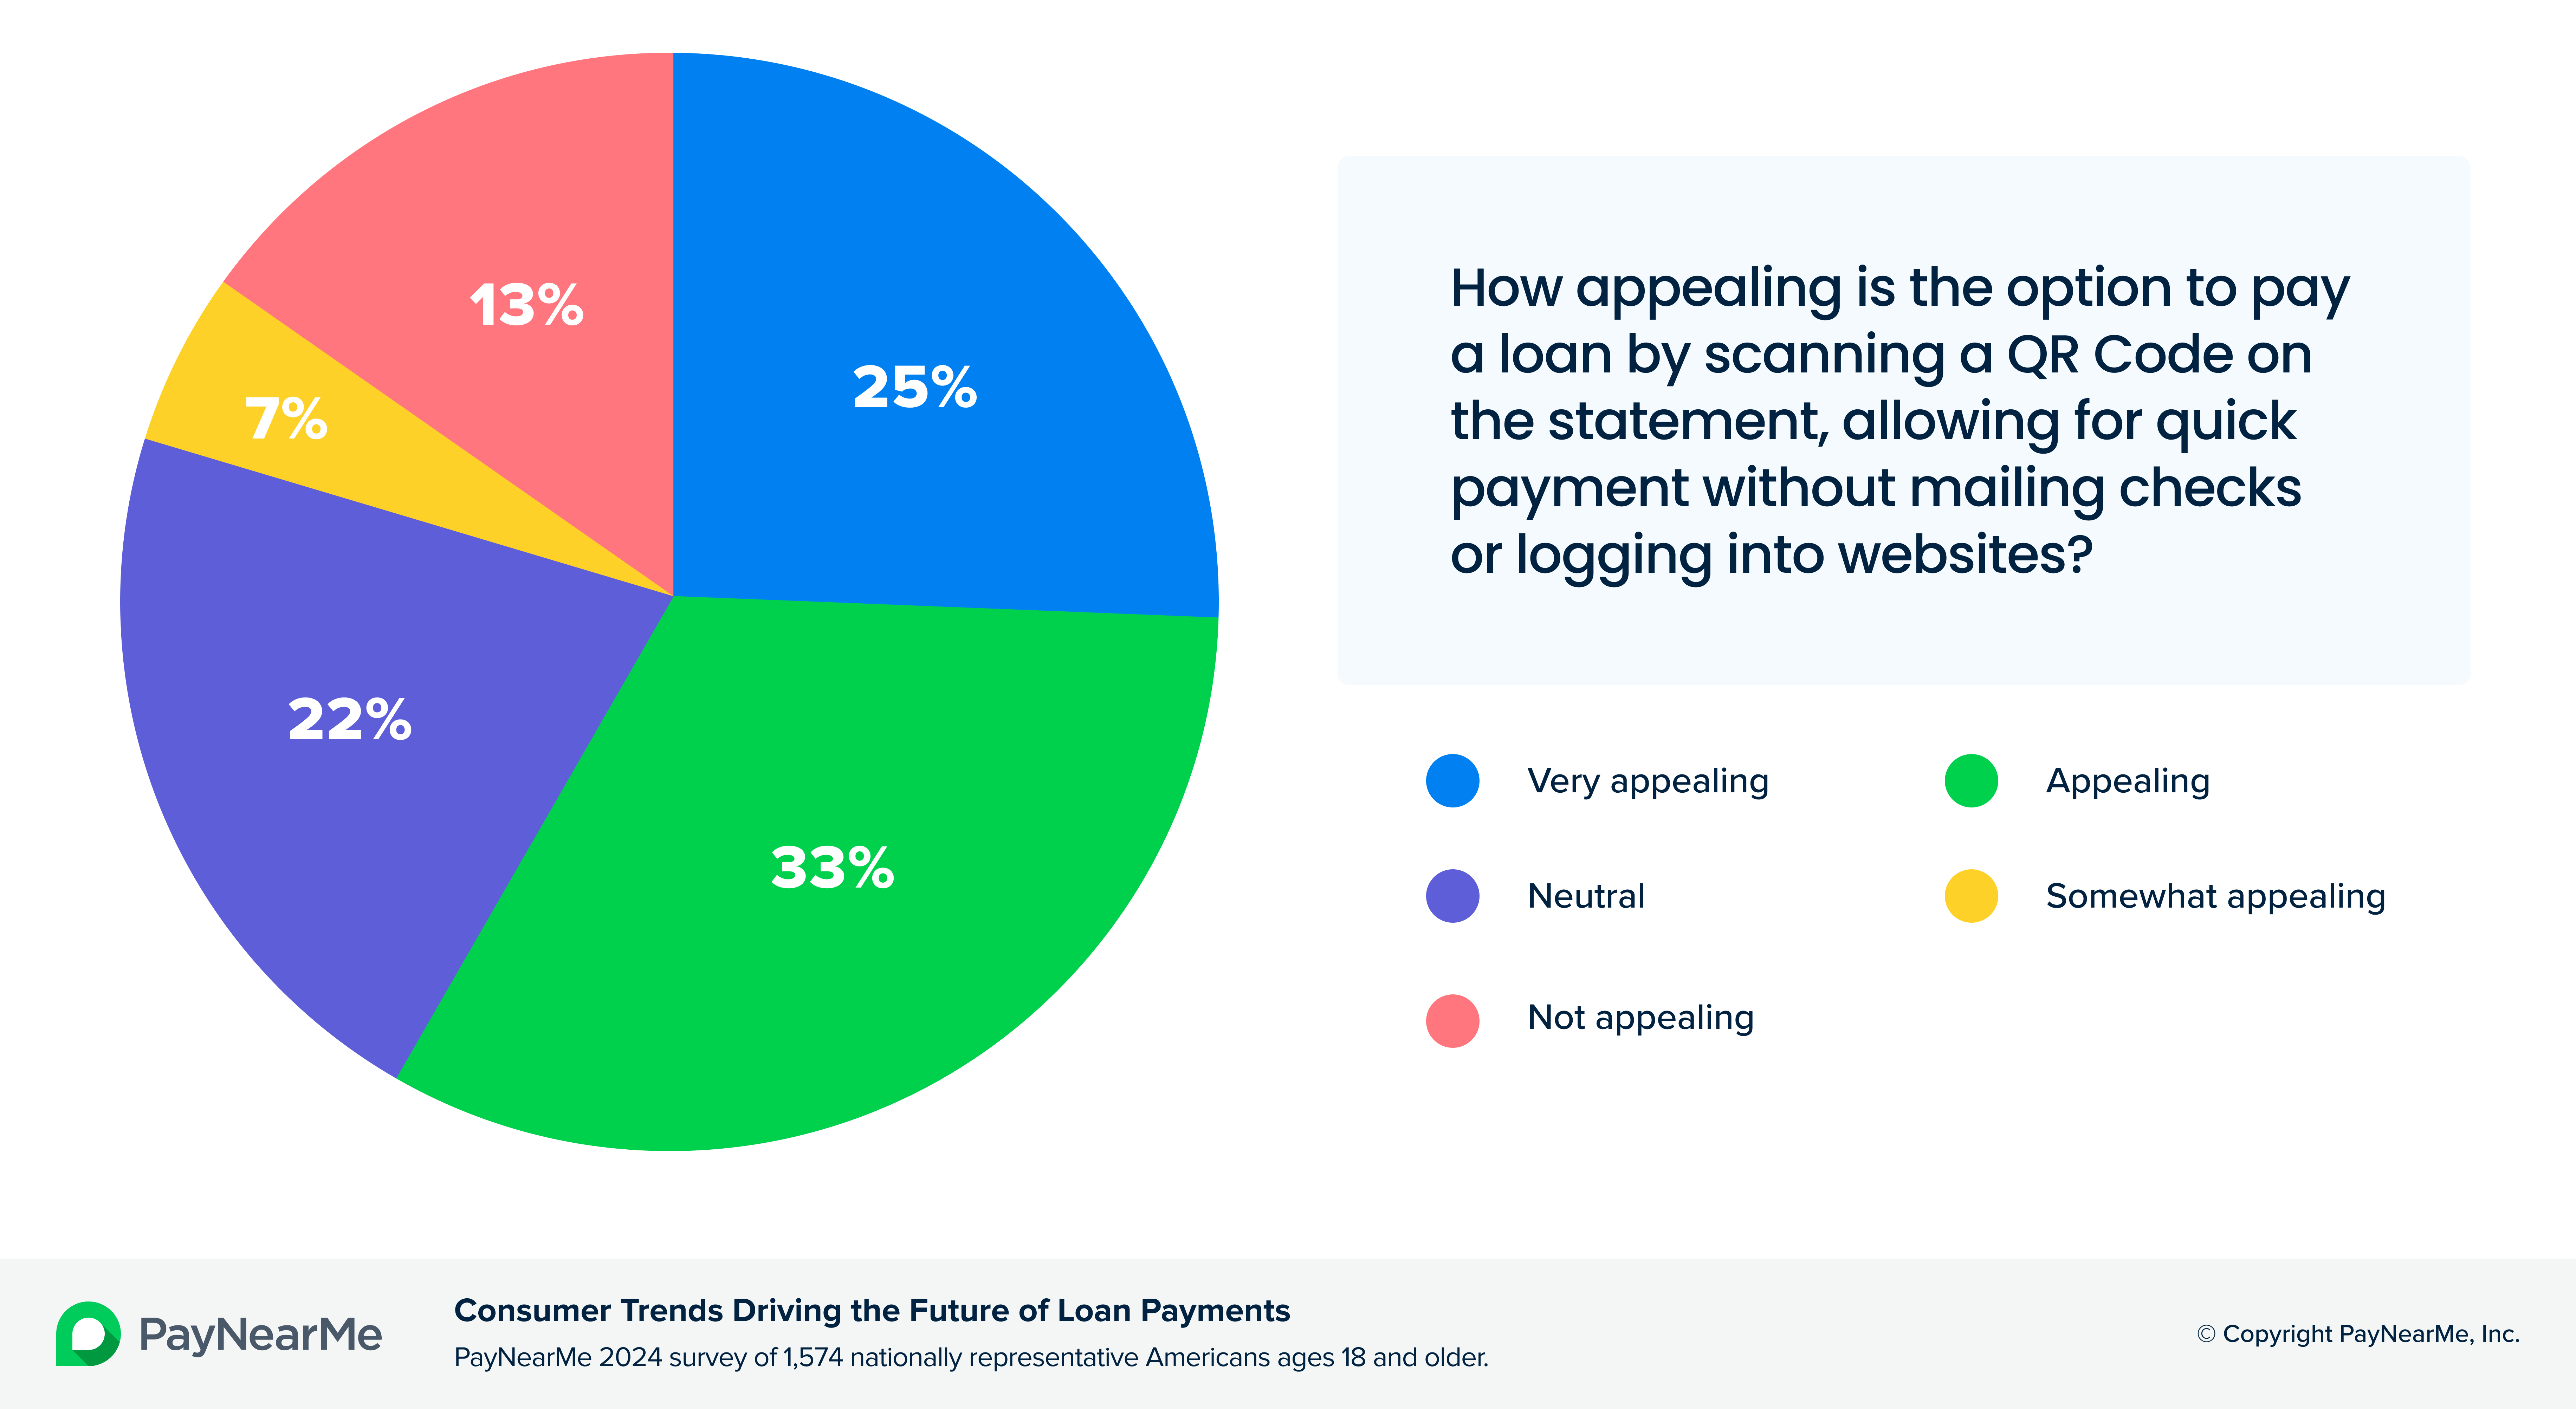 How appealing are QR code payments?
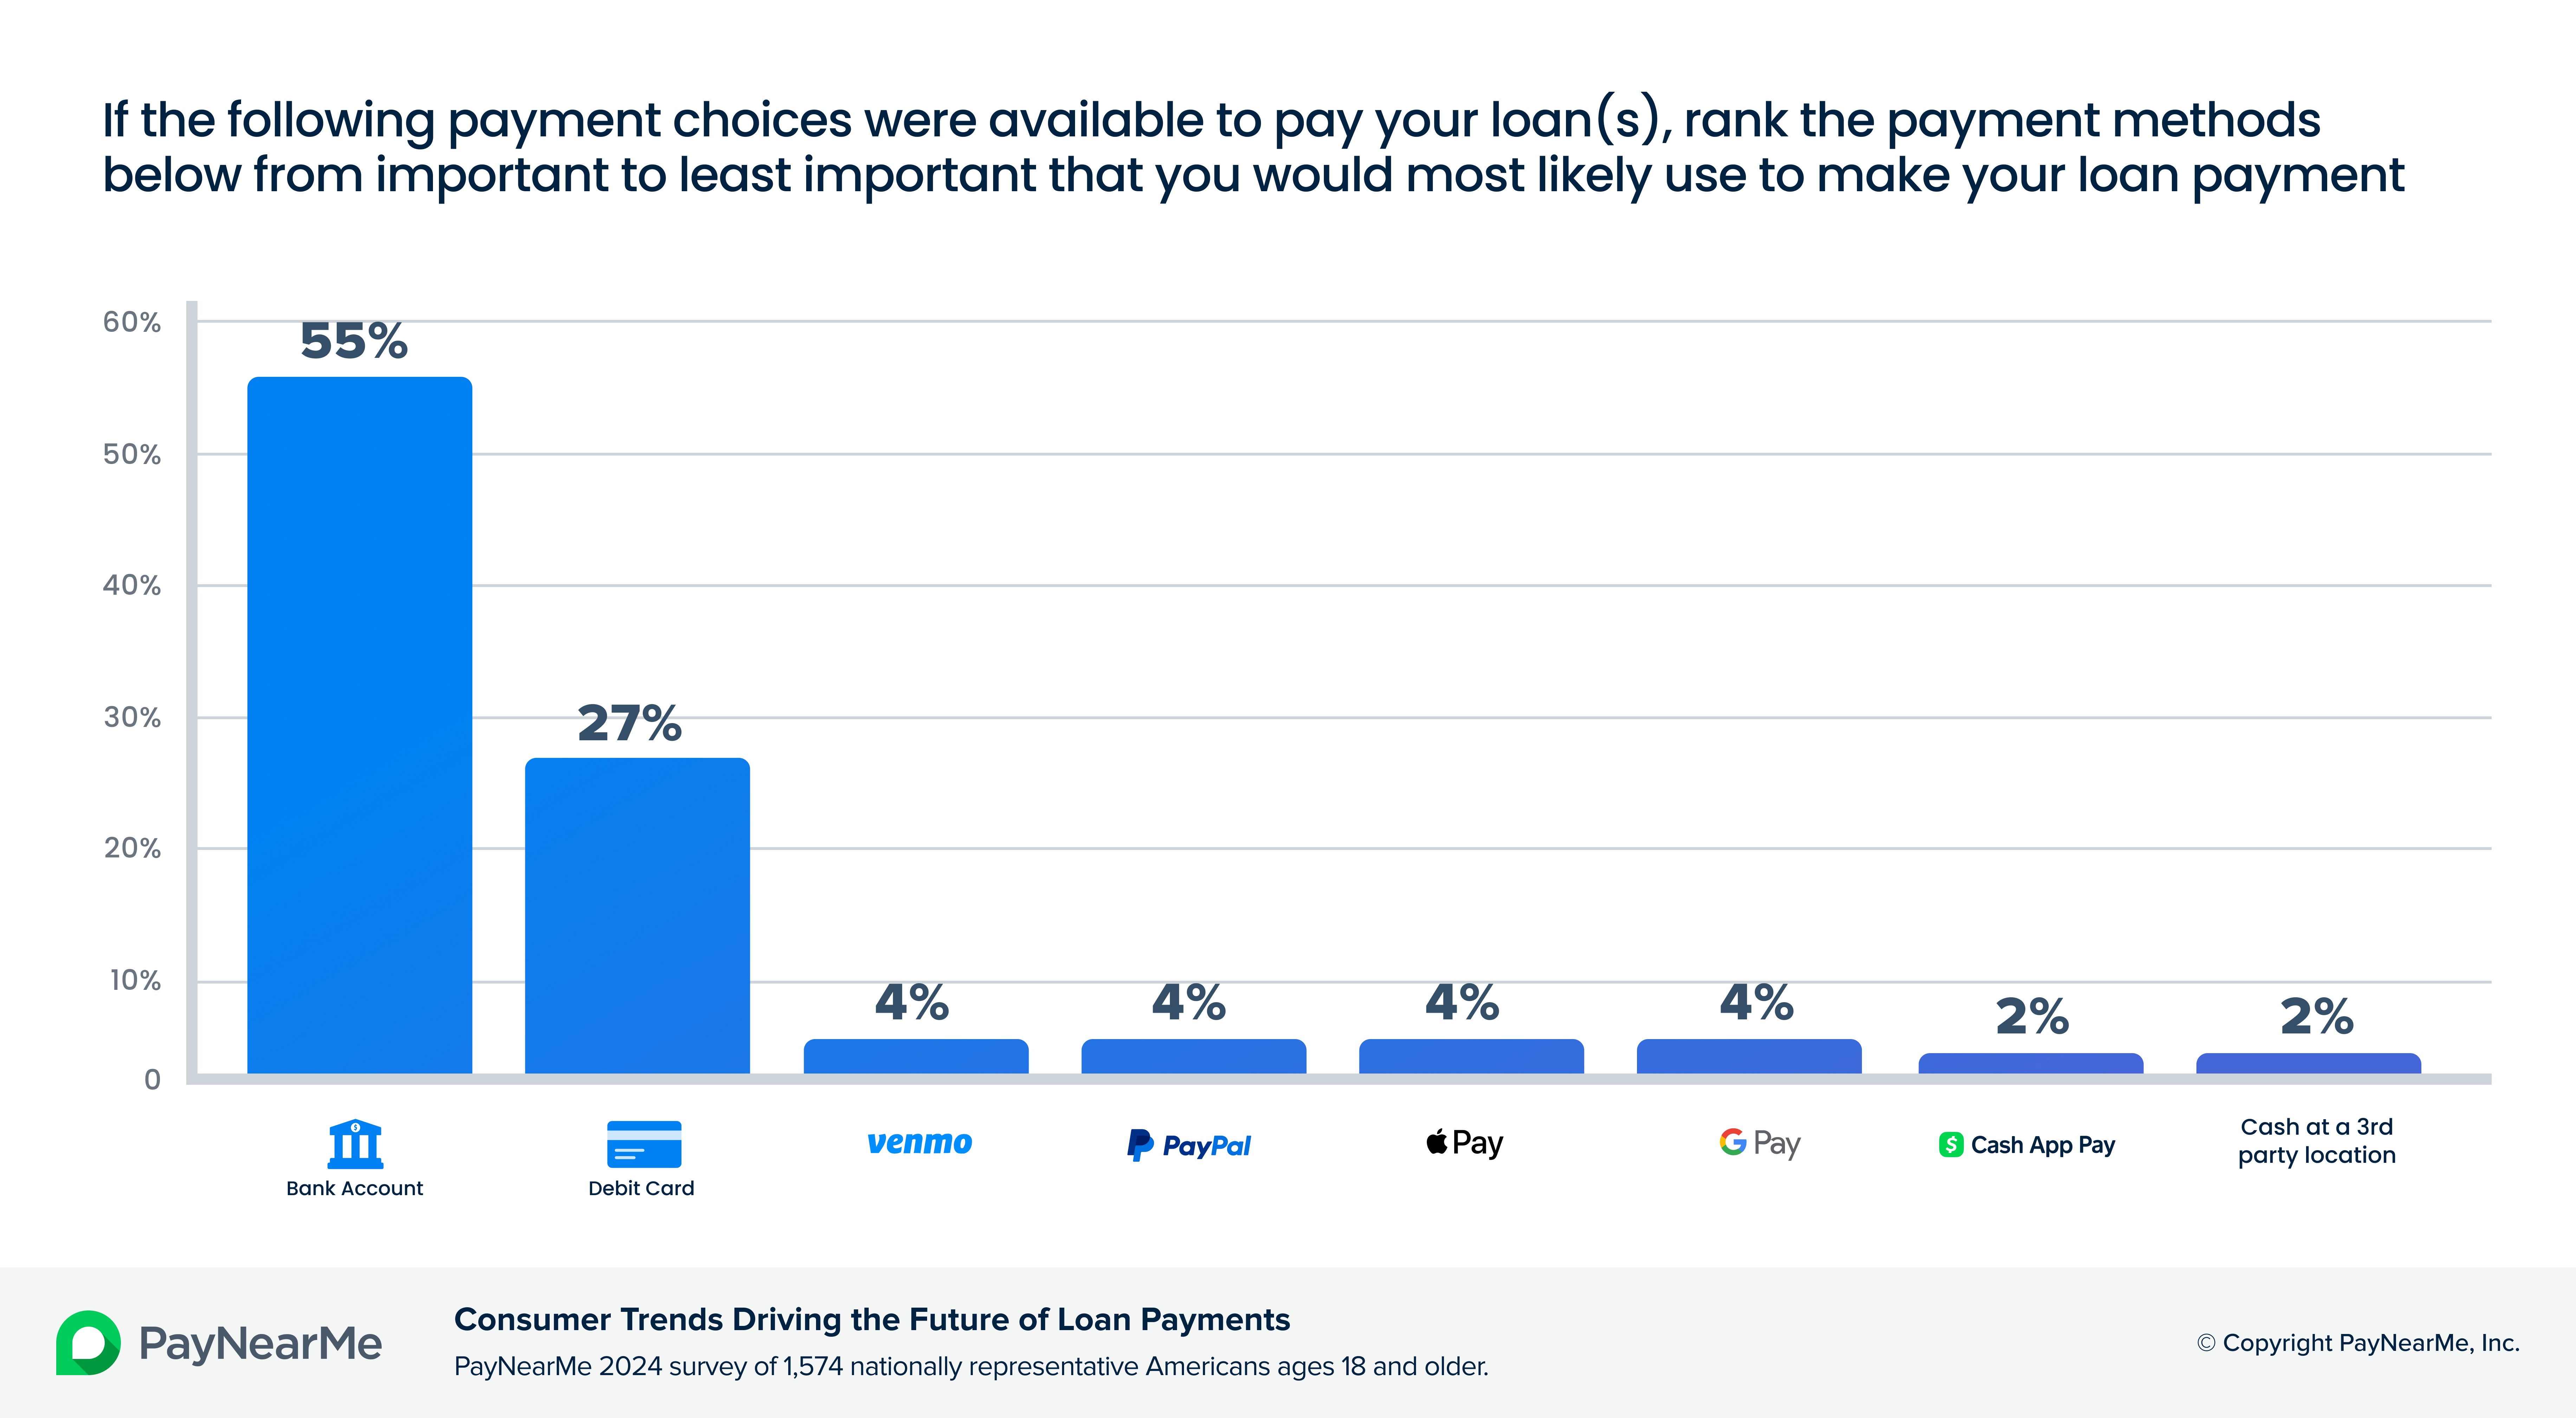 How do consumers rank payment methods?
 What channels do consumers use to pay loans?
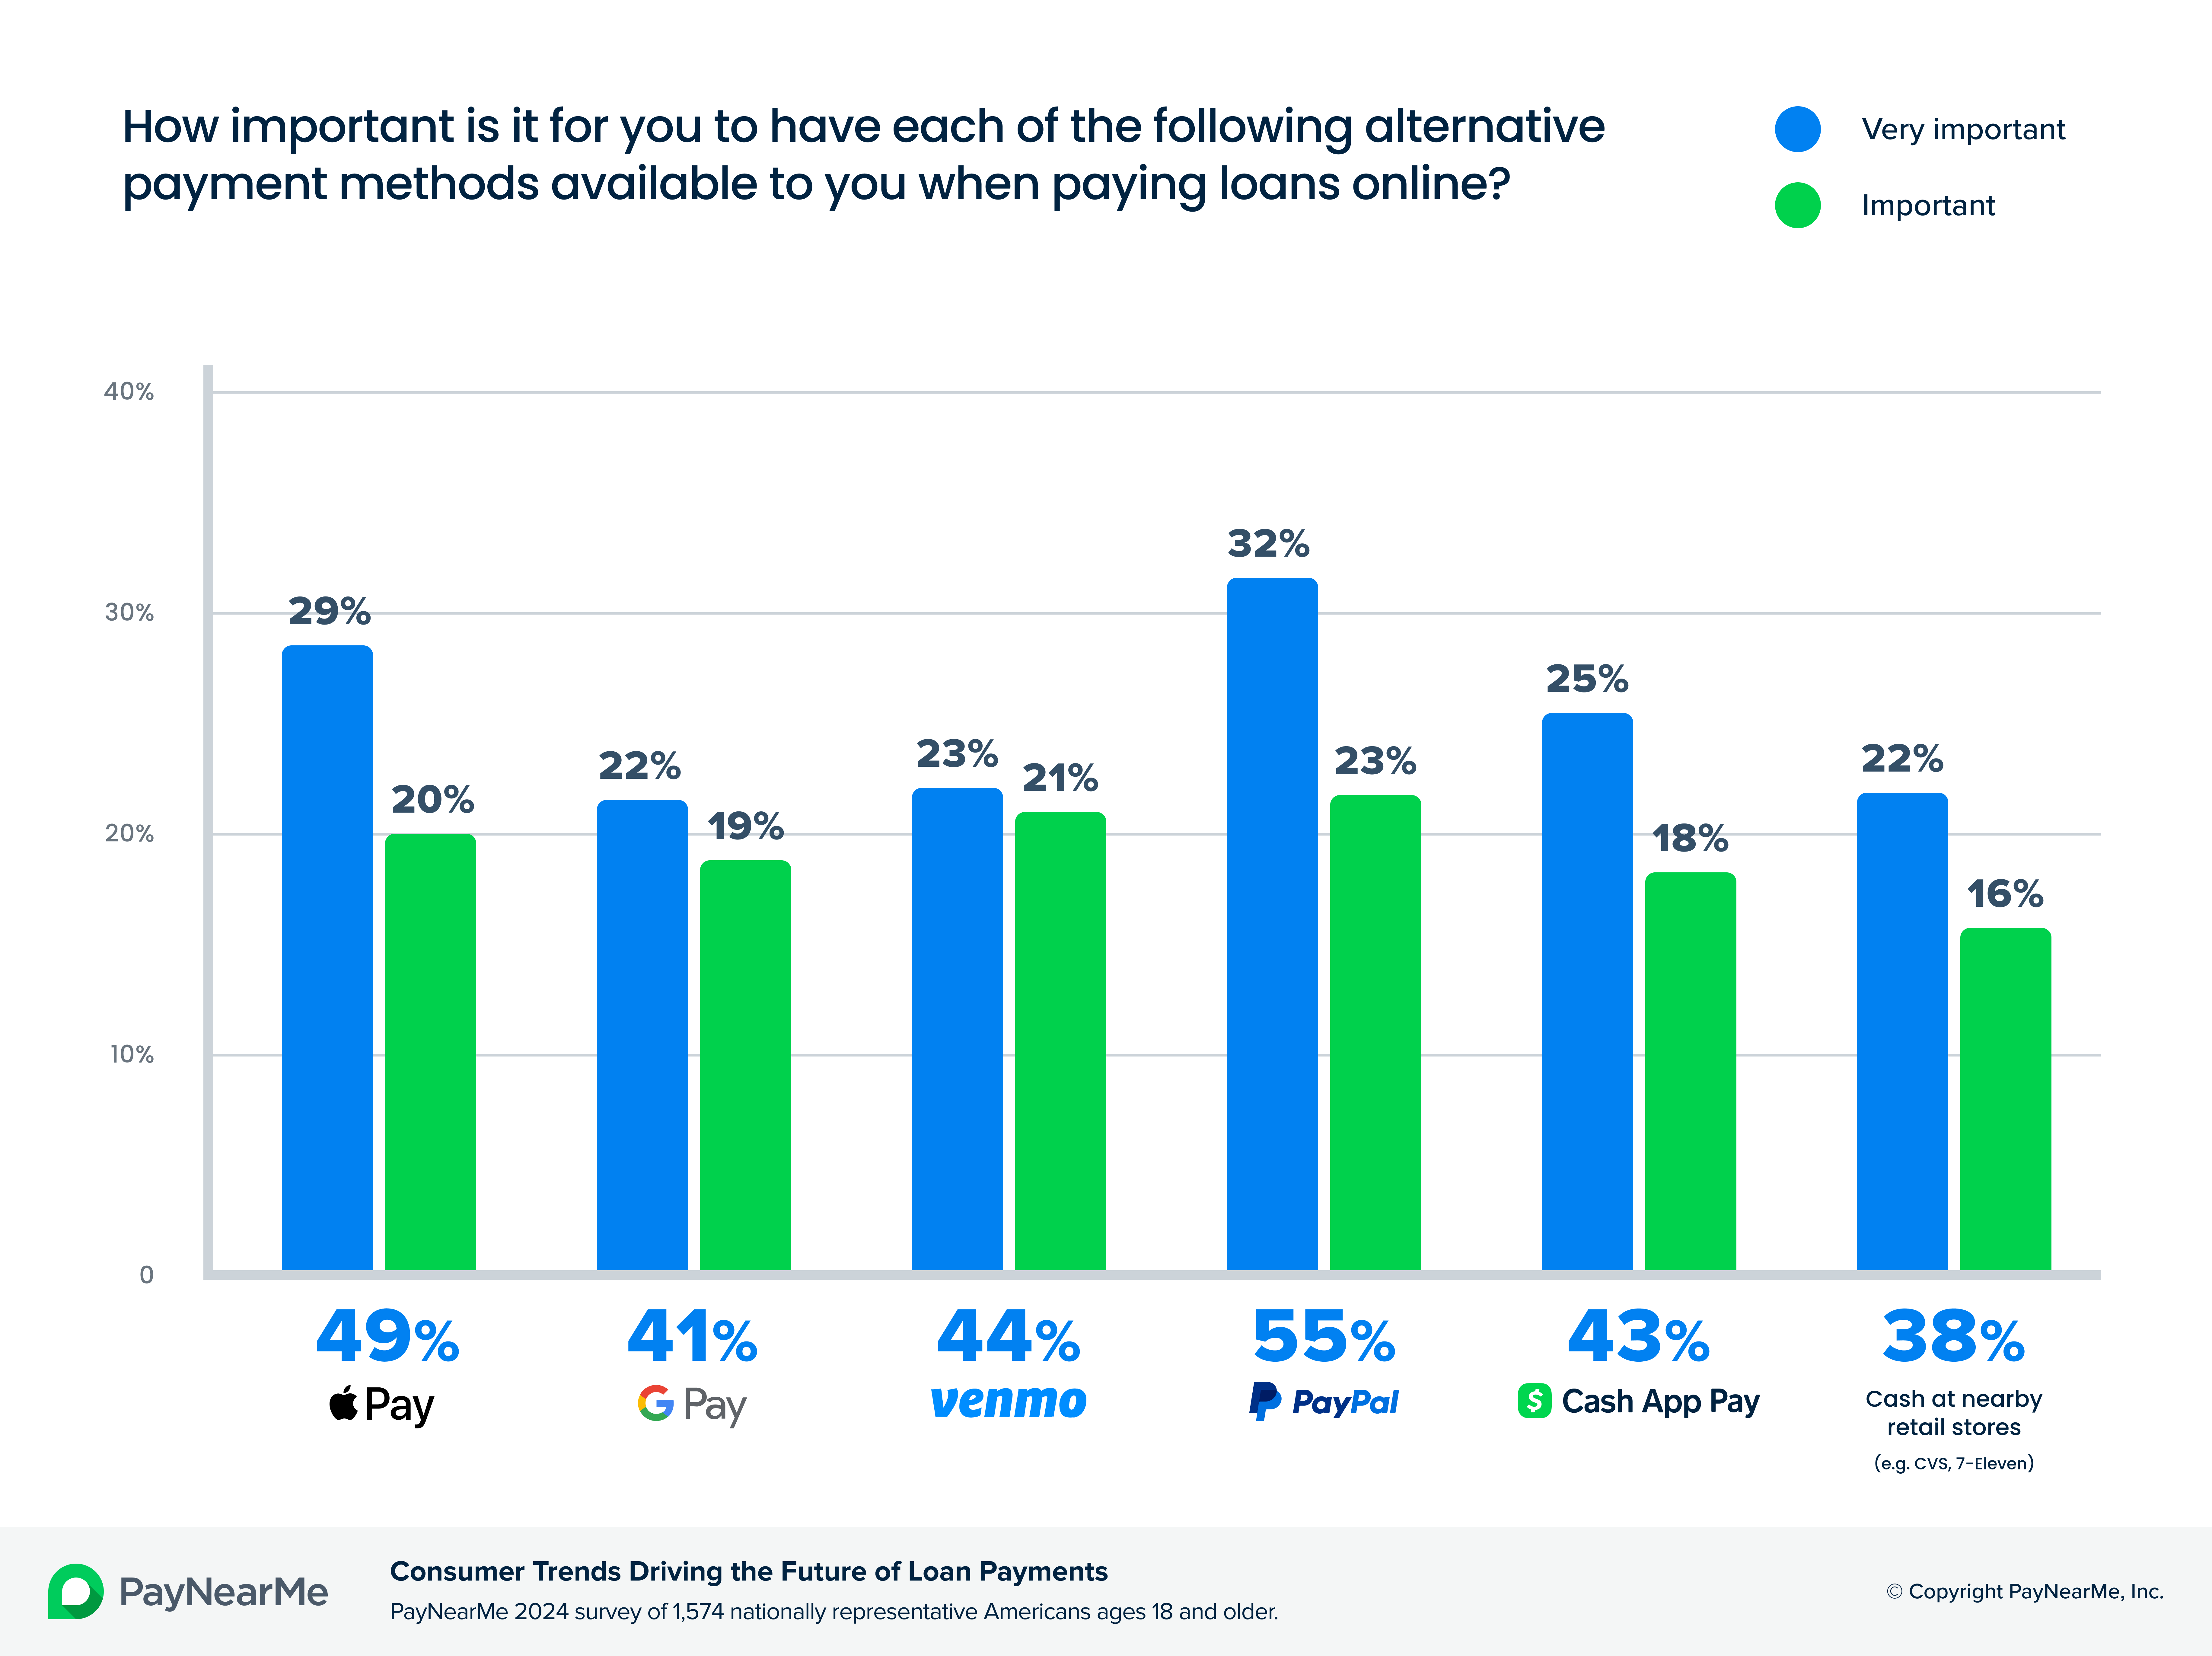 How do consumers rank alternative payments?
 Are consumers stressed with the loan repayment experience?
 How consumers feel about autopay
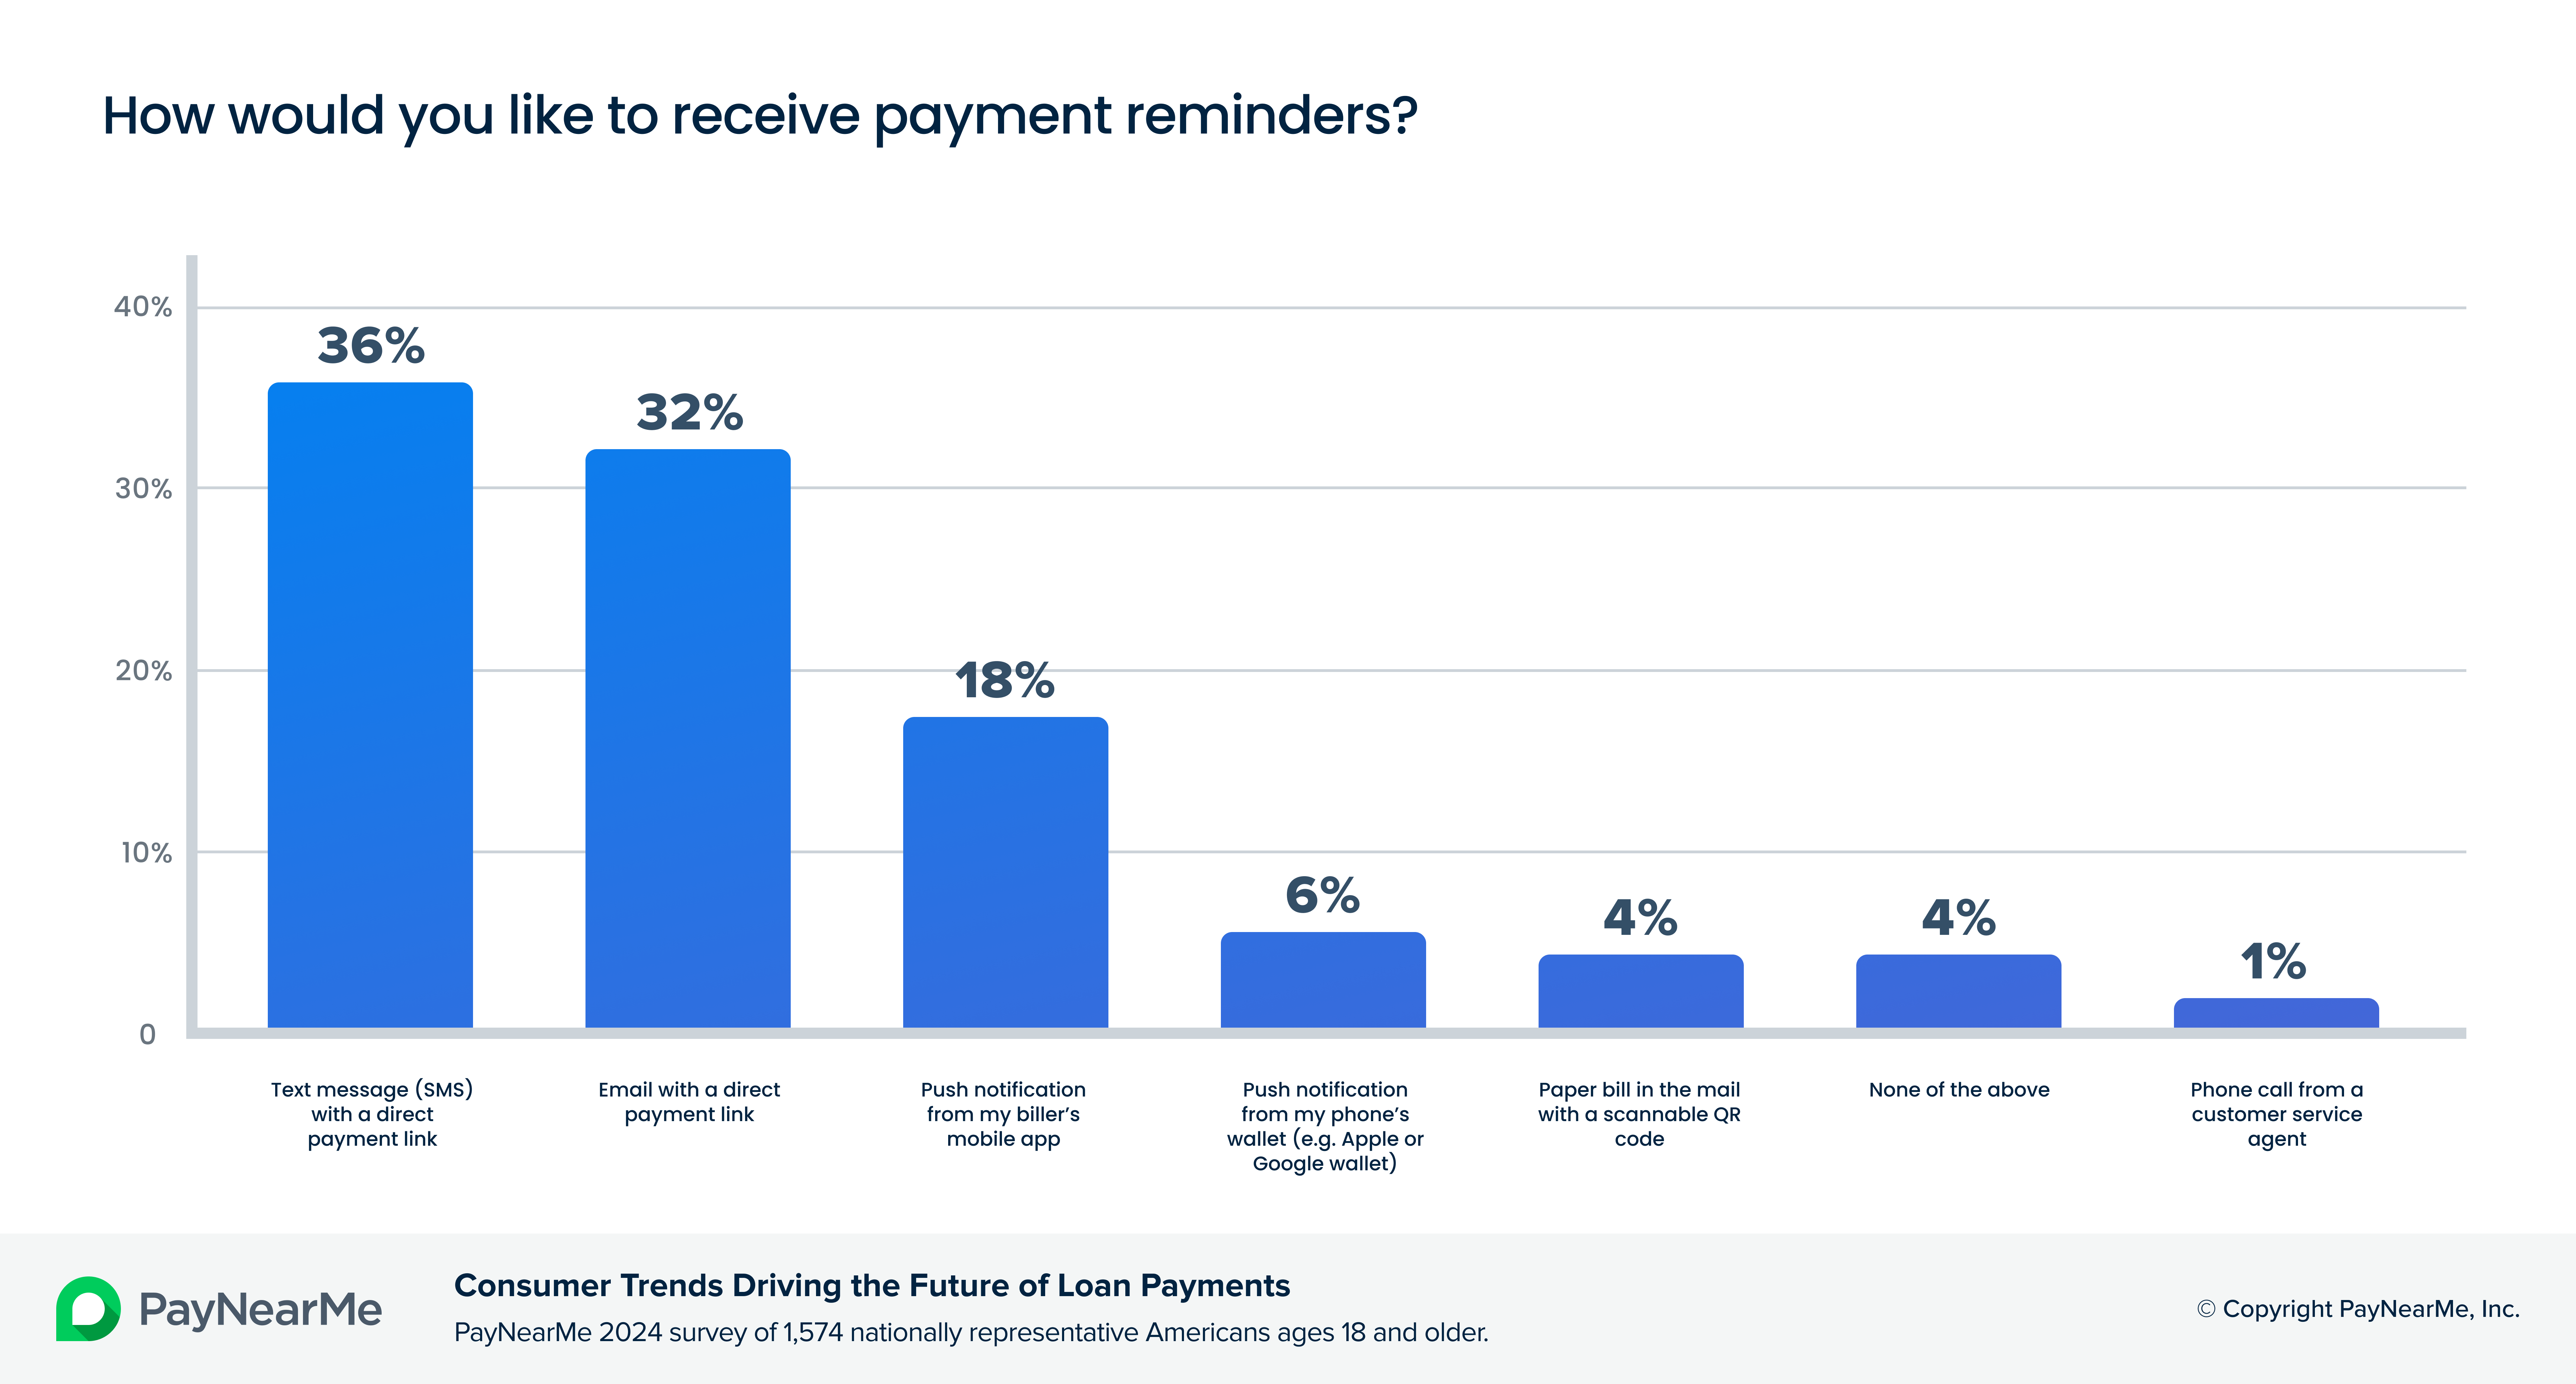 How consumers feel about payment reminders
 How important is a personalized experience?
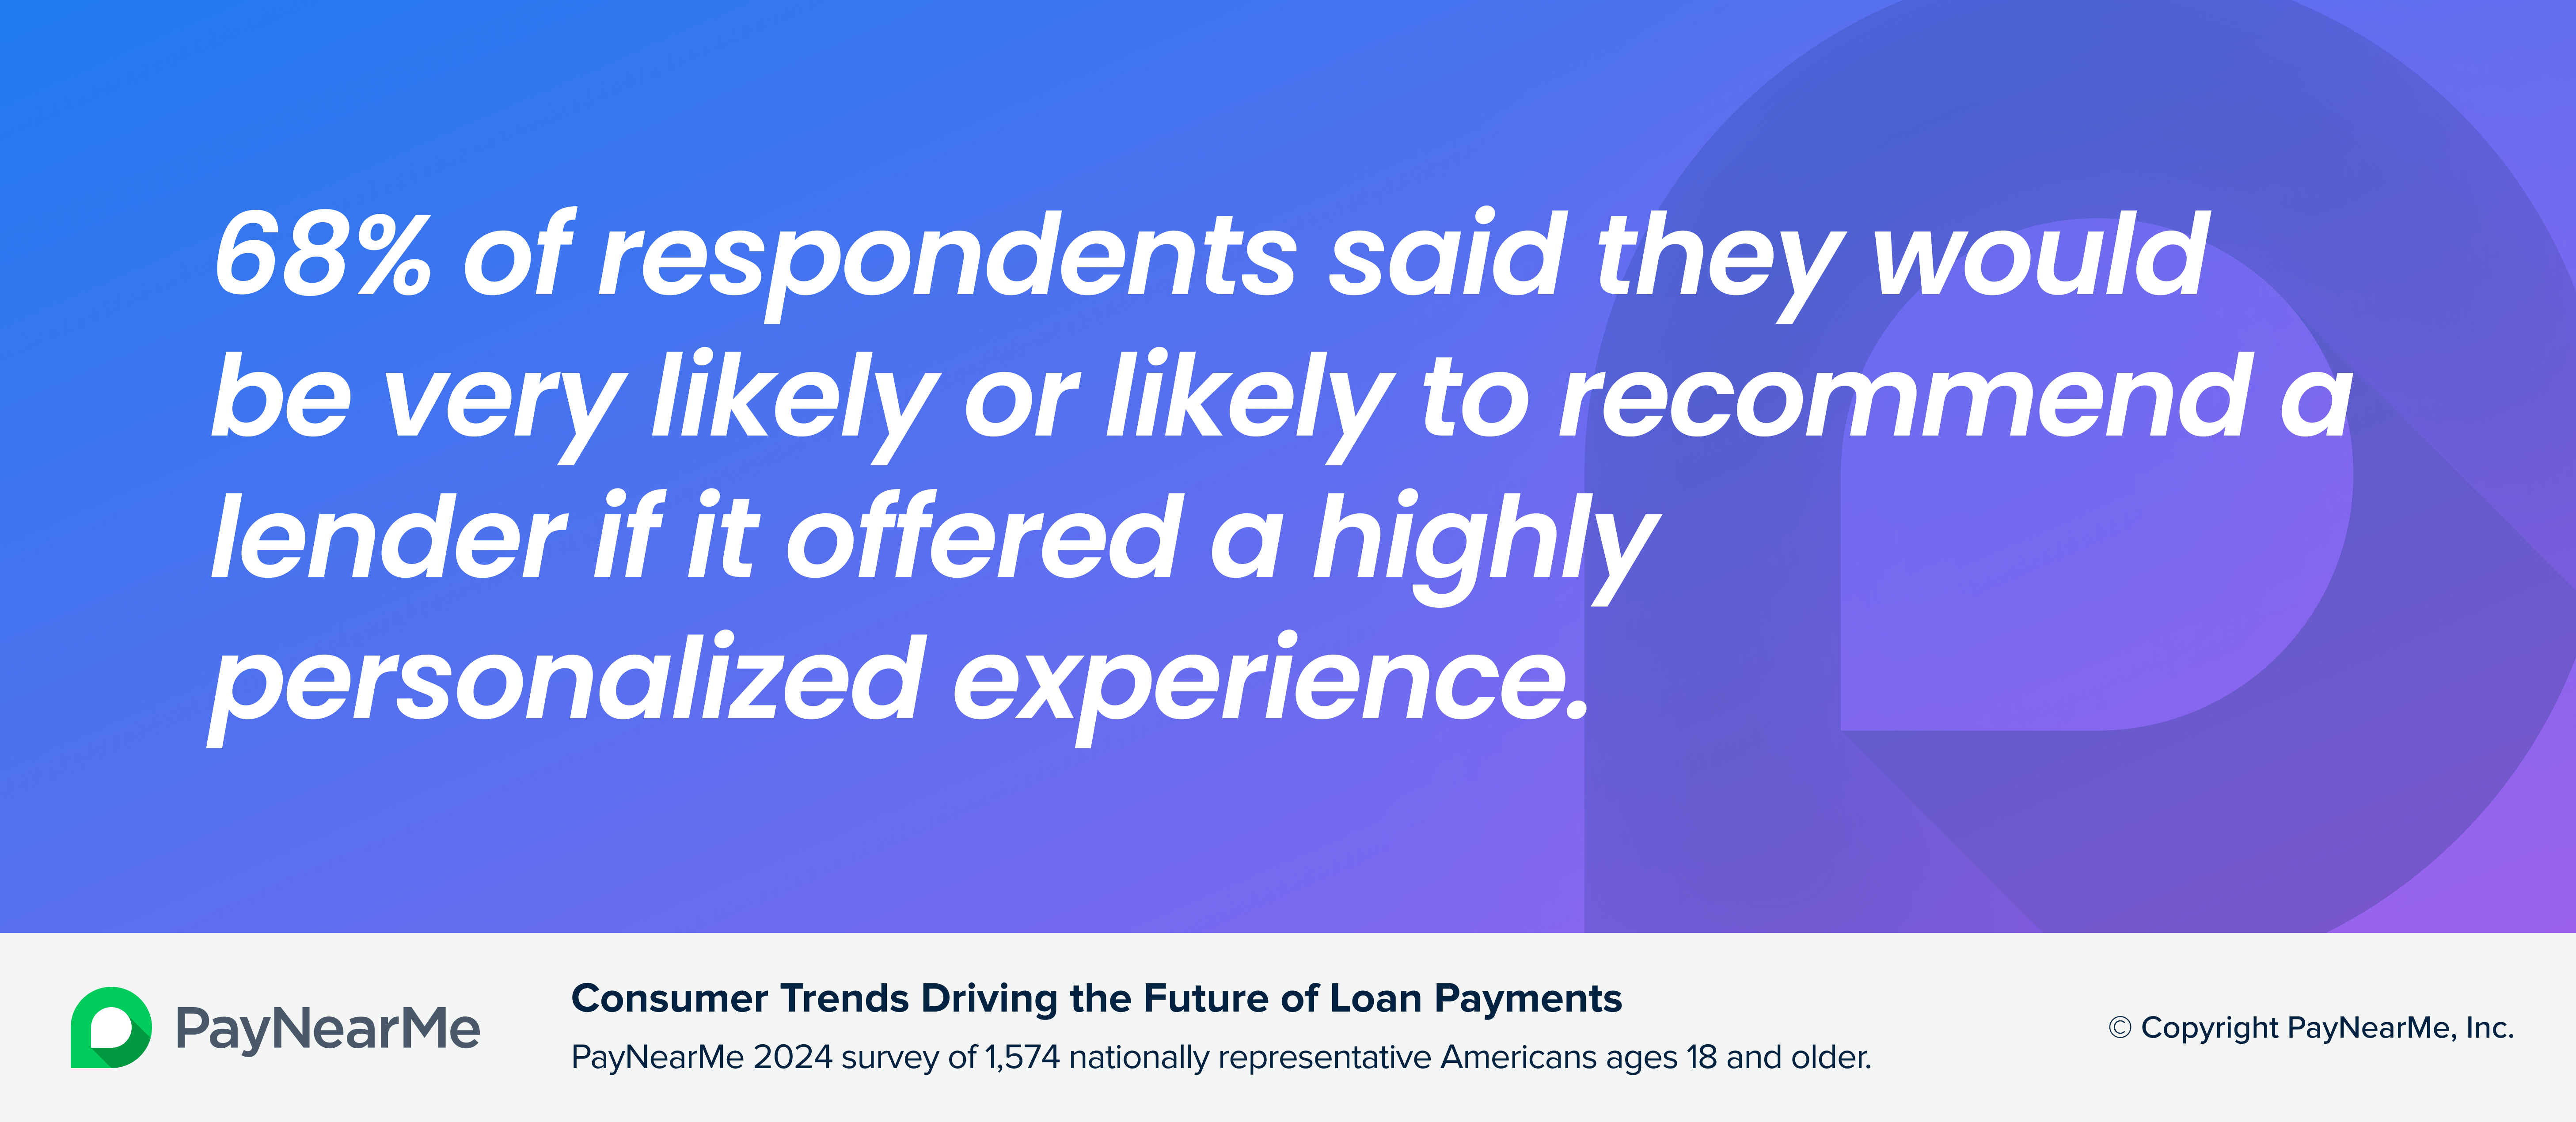 Would consumers recommend a lender if they offered a personalized experience?
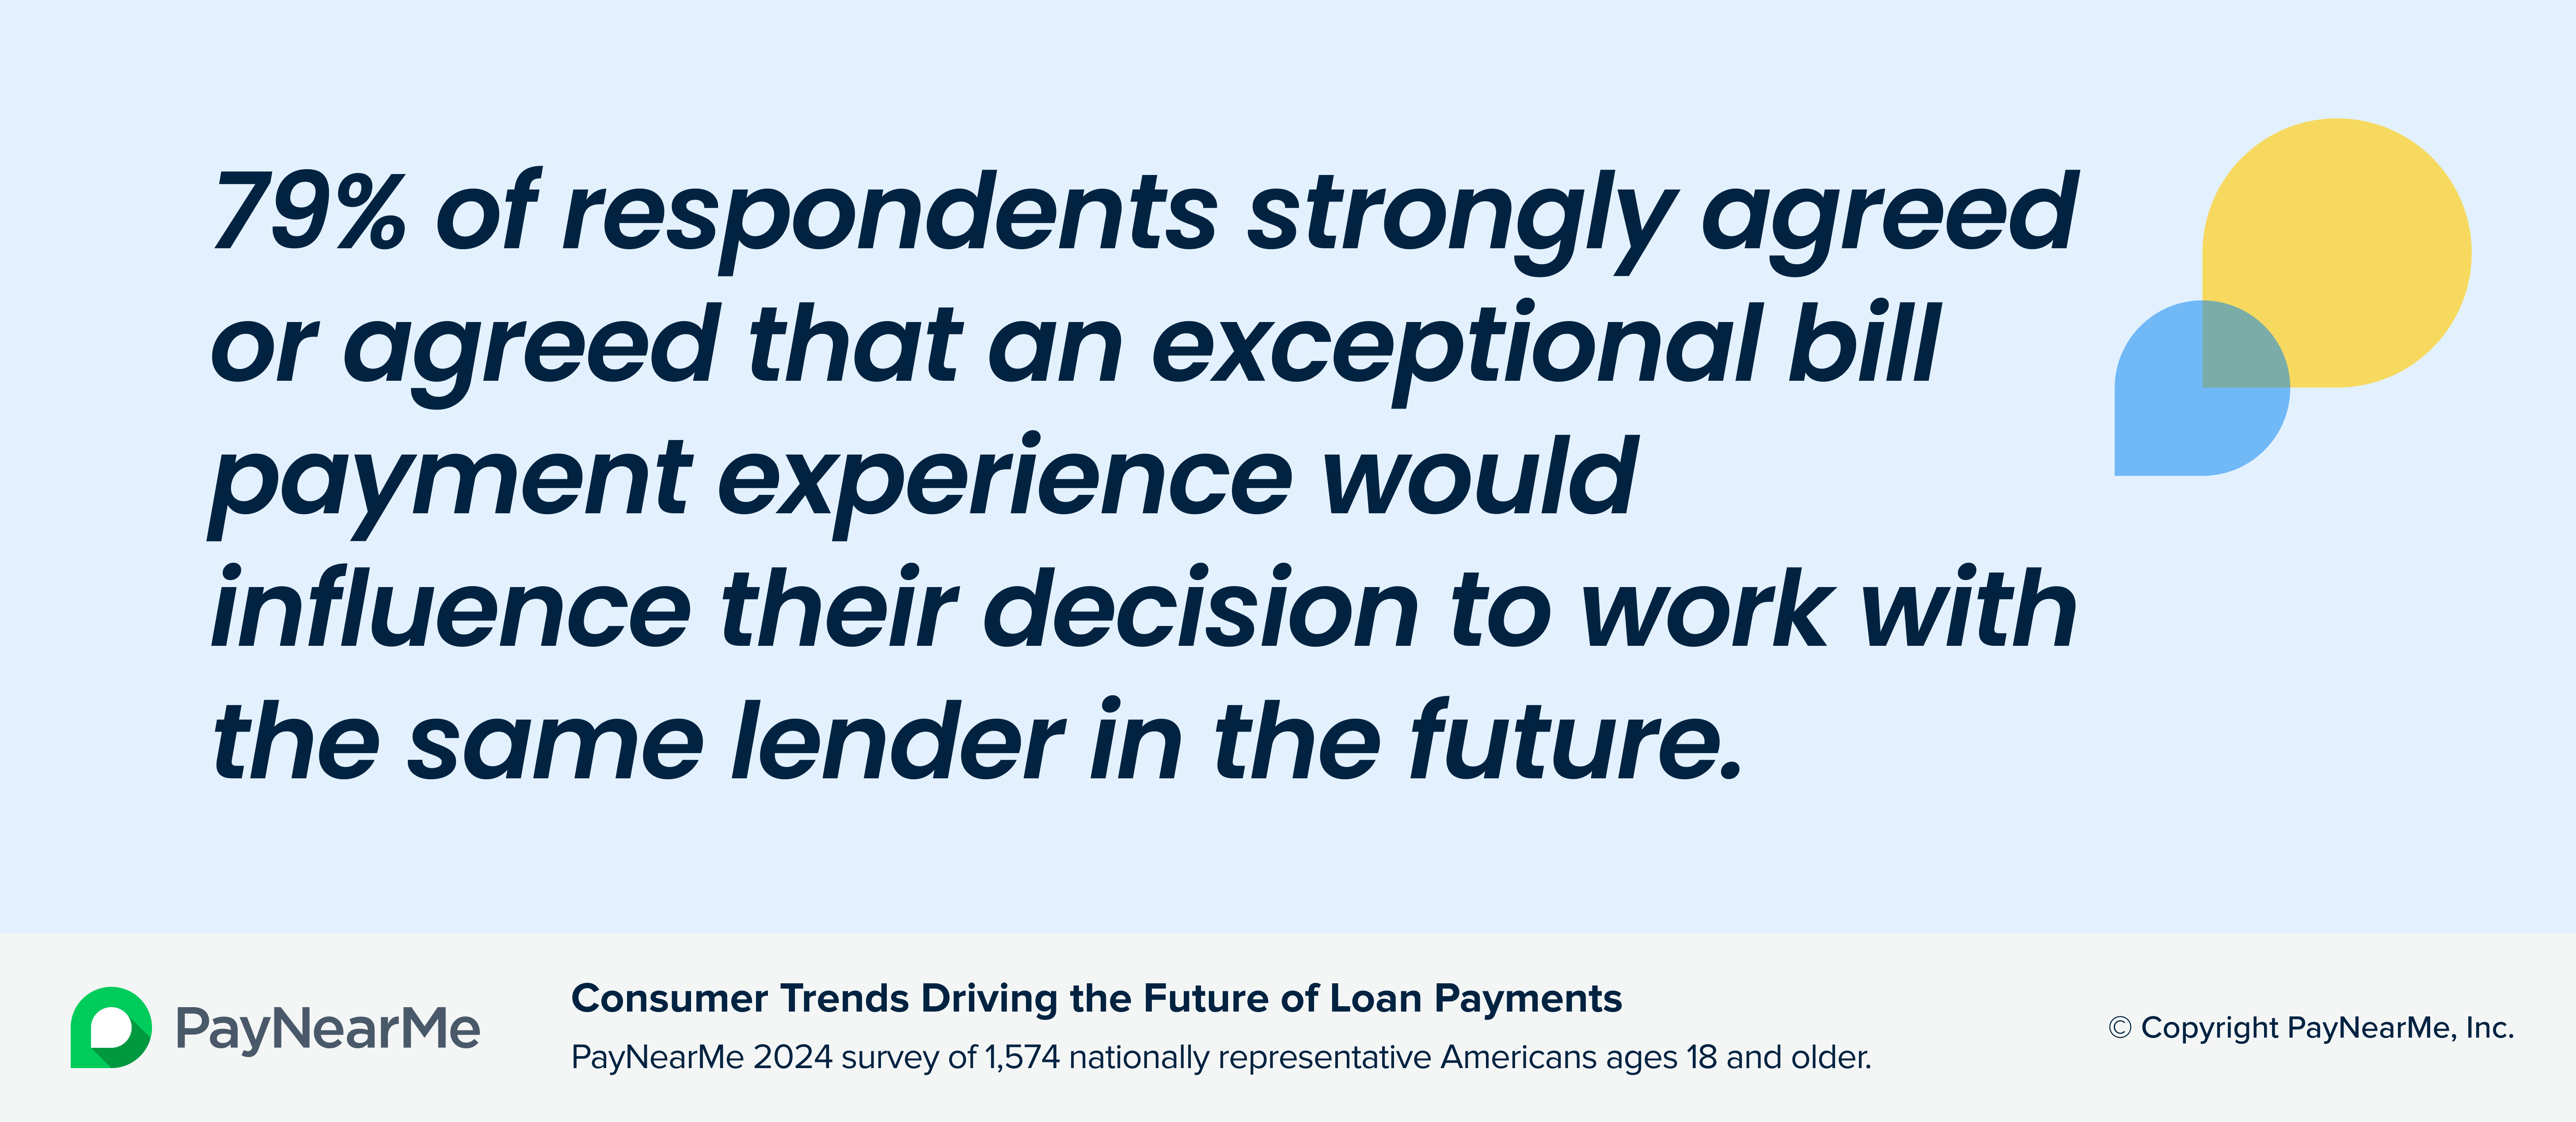
 Will consumers work with a lender in the future if they have an exceptional experience?
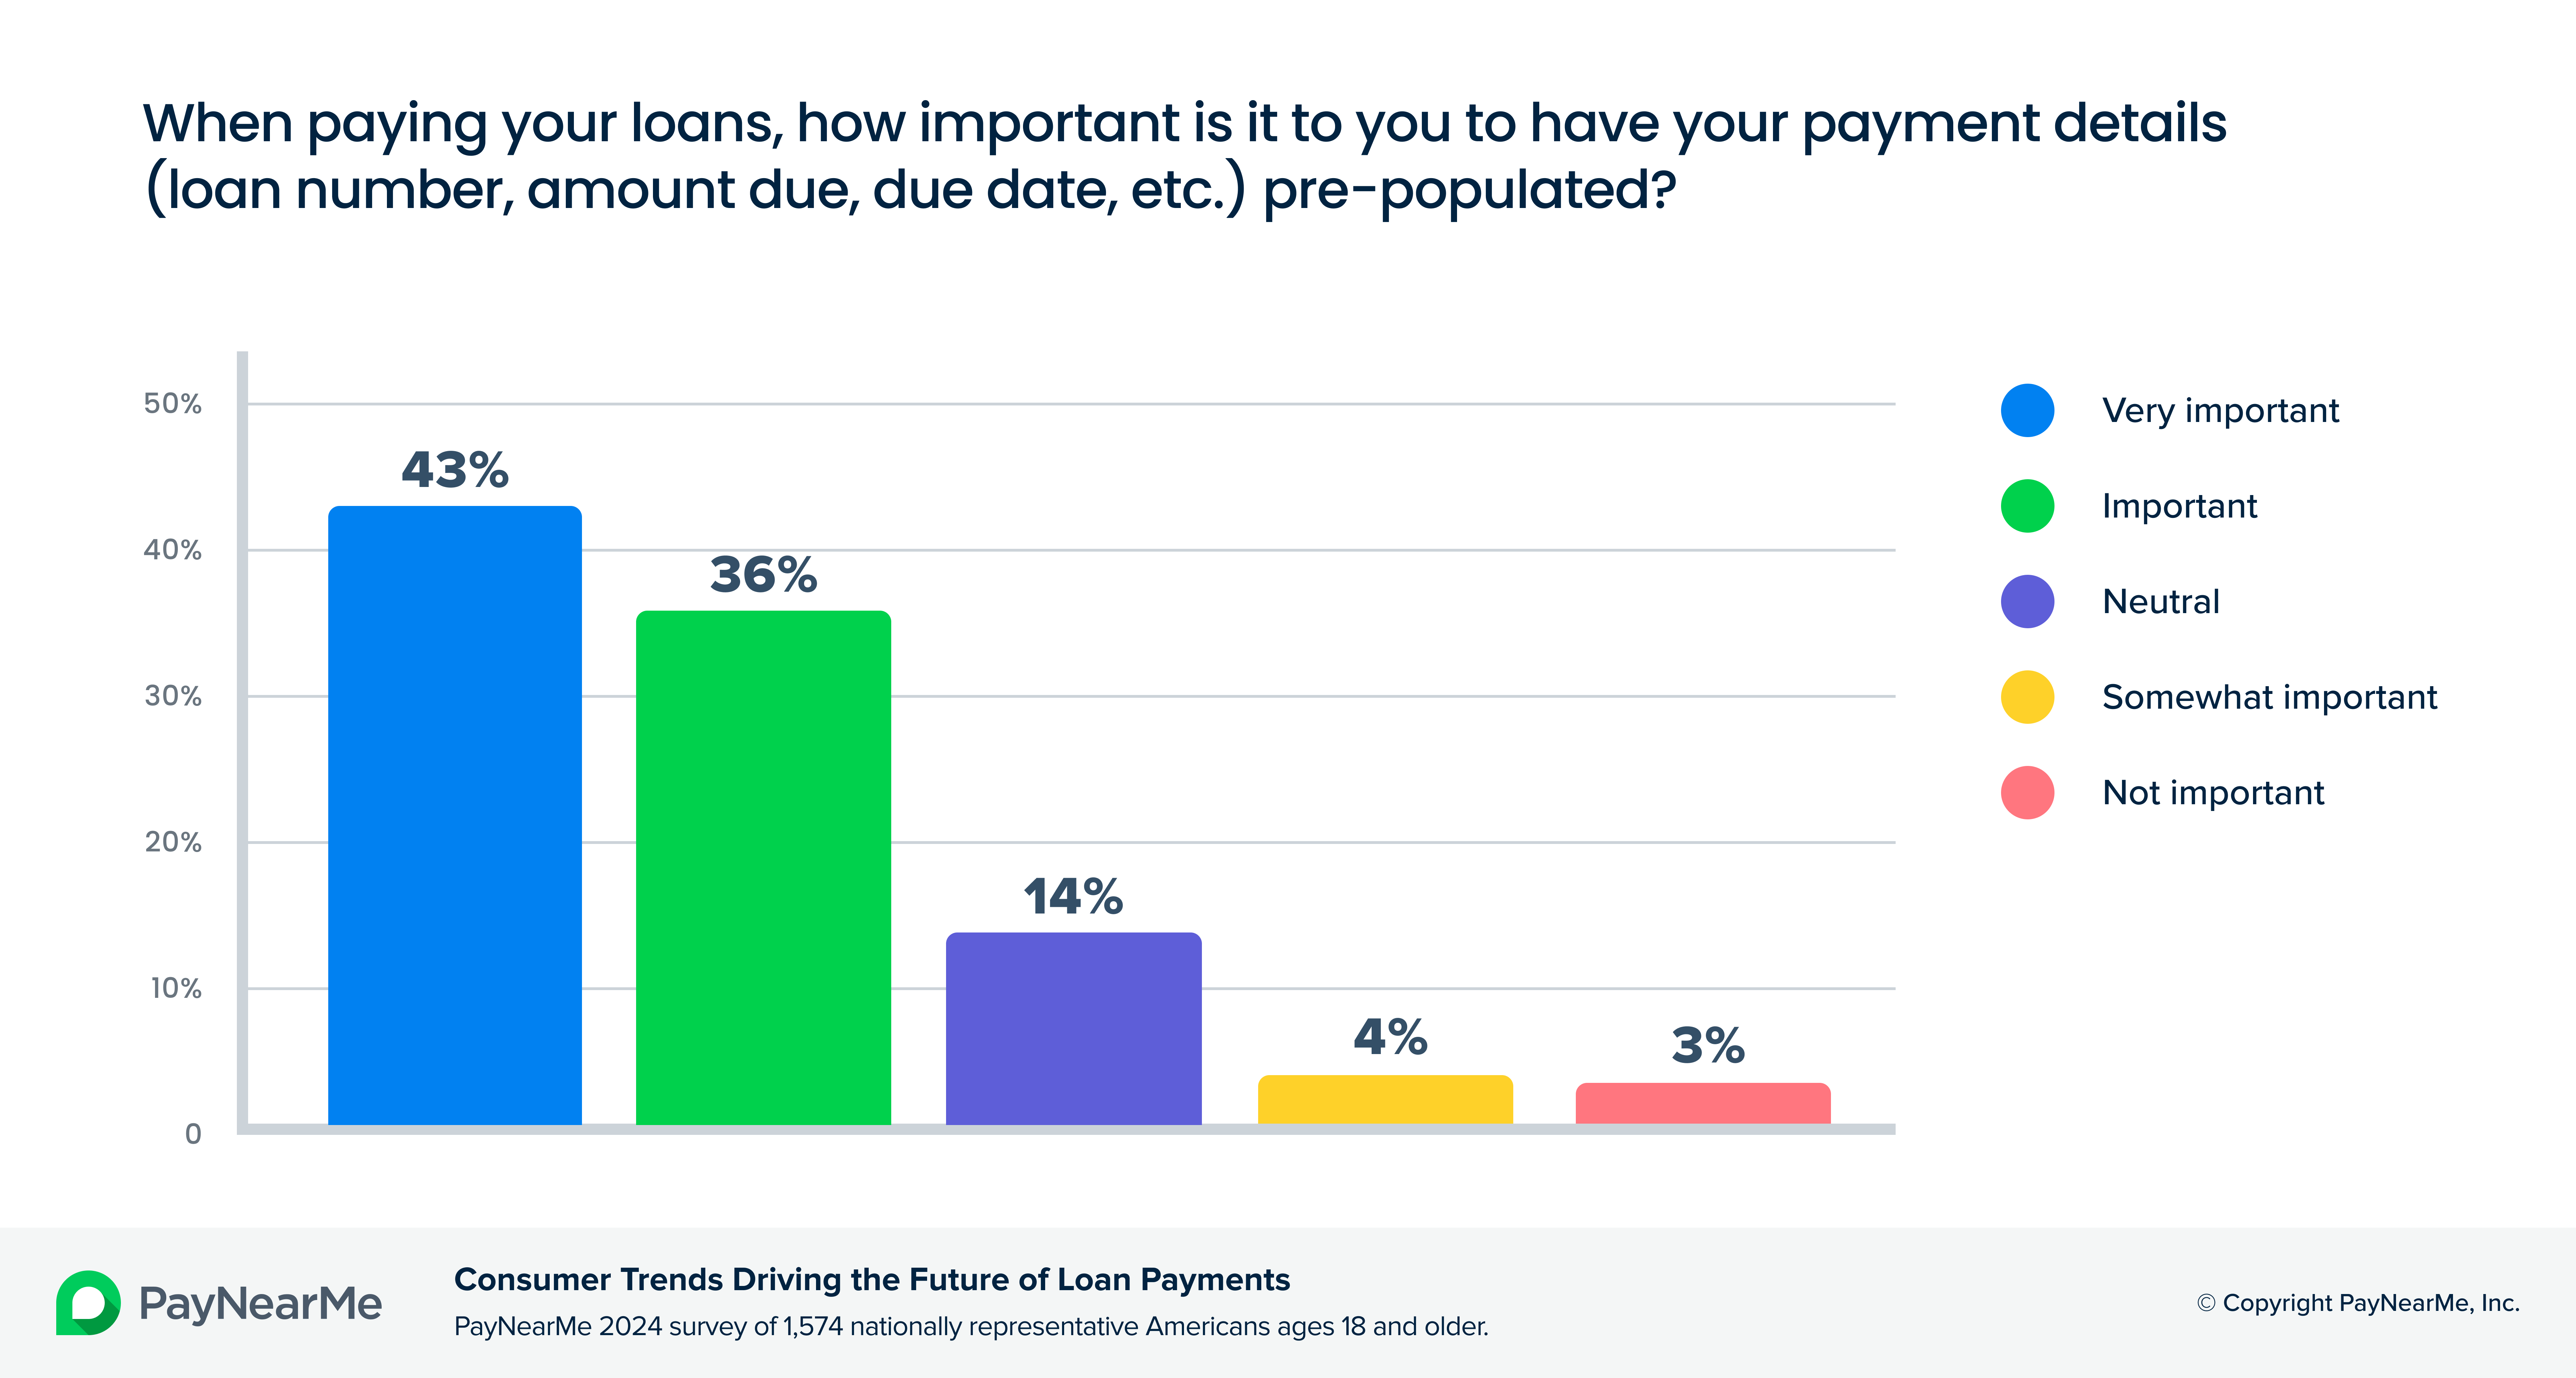 How important are pre-populated details?
 How do consumers want to receive funds from their lenders?
 Percent of consumers that will work with a lender in the future if they have an exceptional experience.
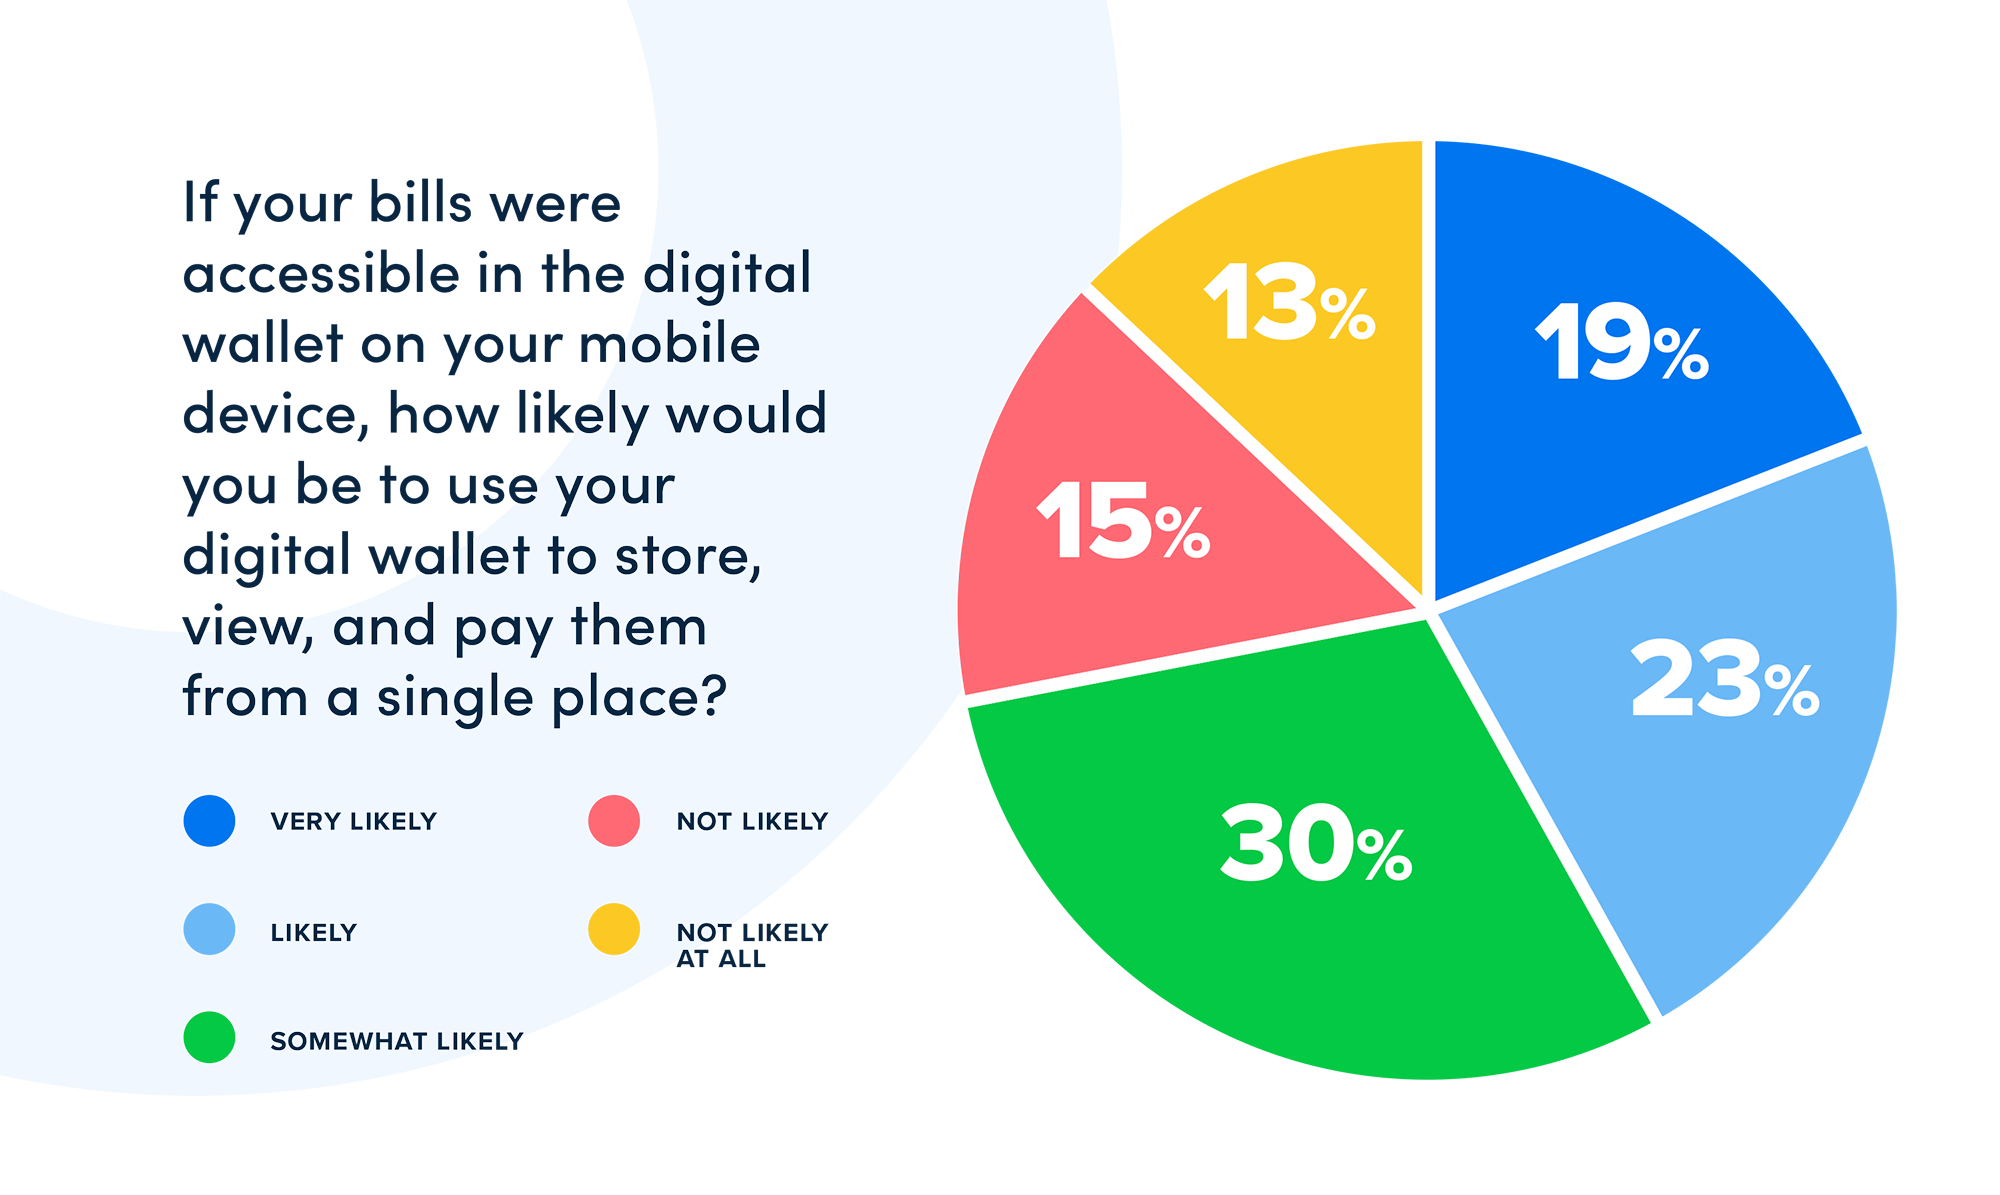
 Likelihood of paying loans with a digital wallet
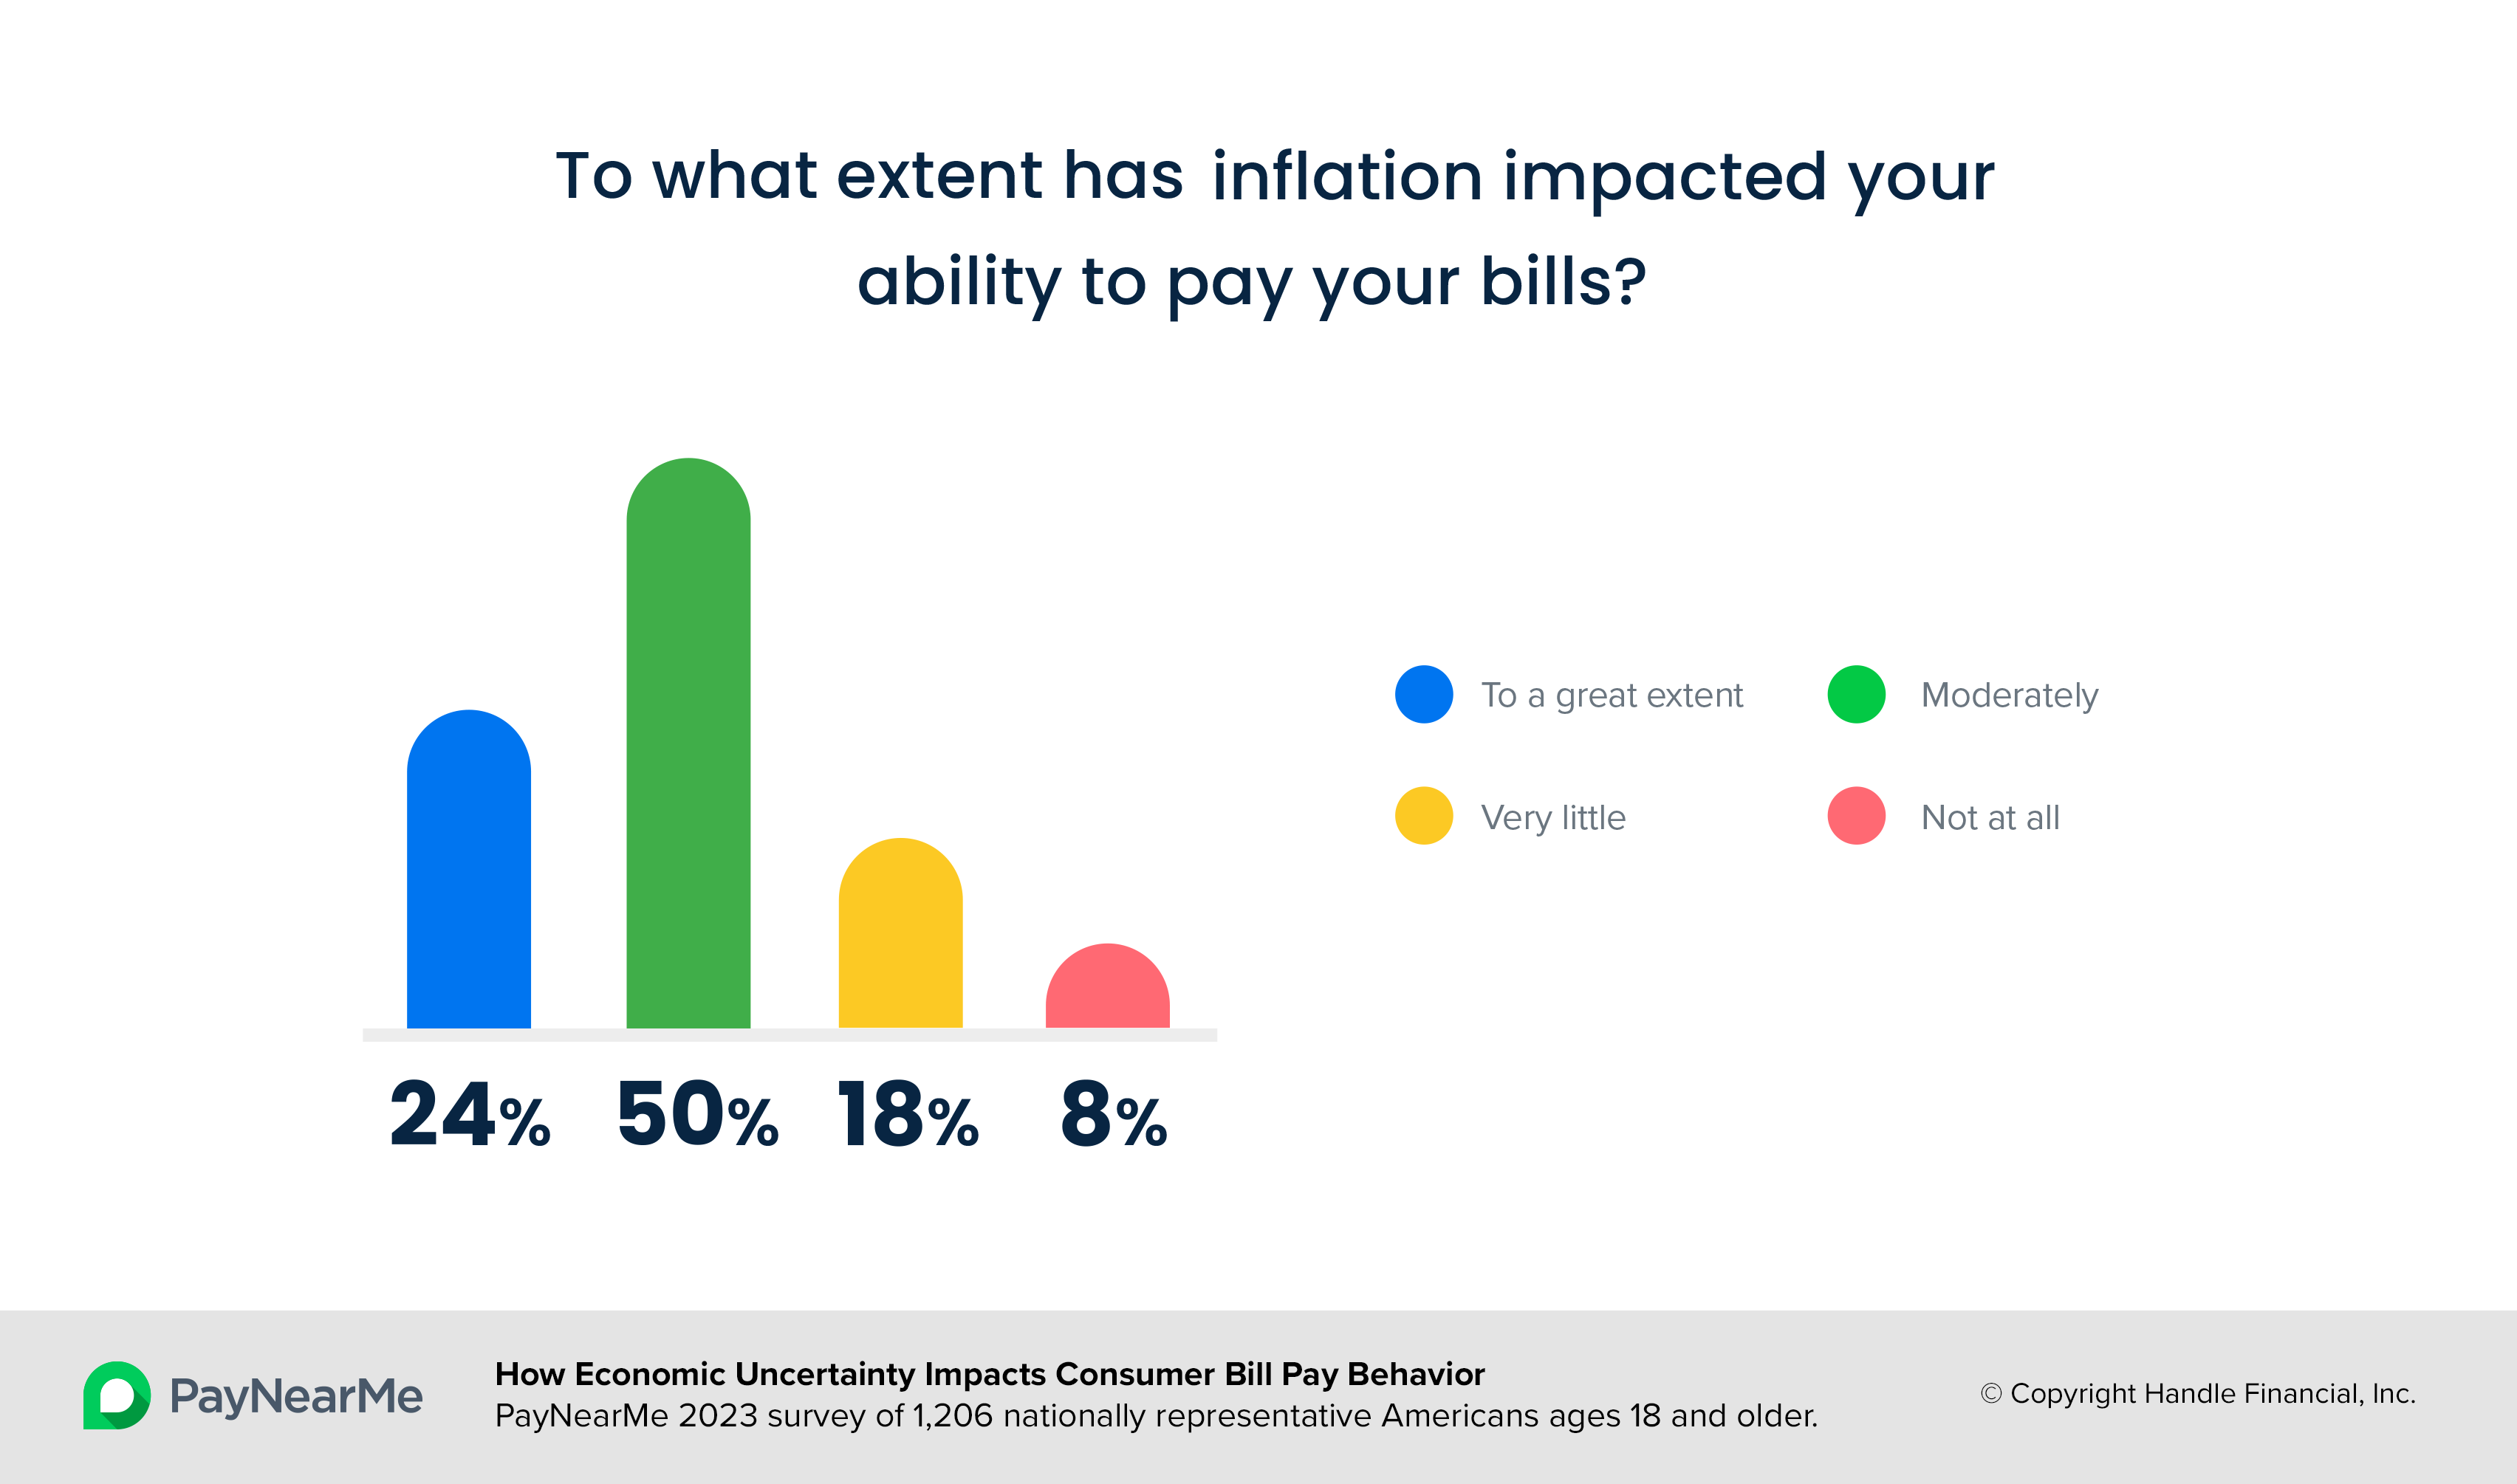
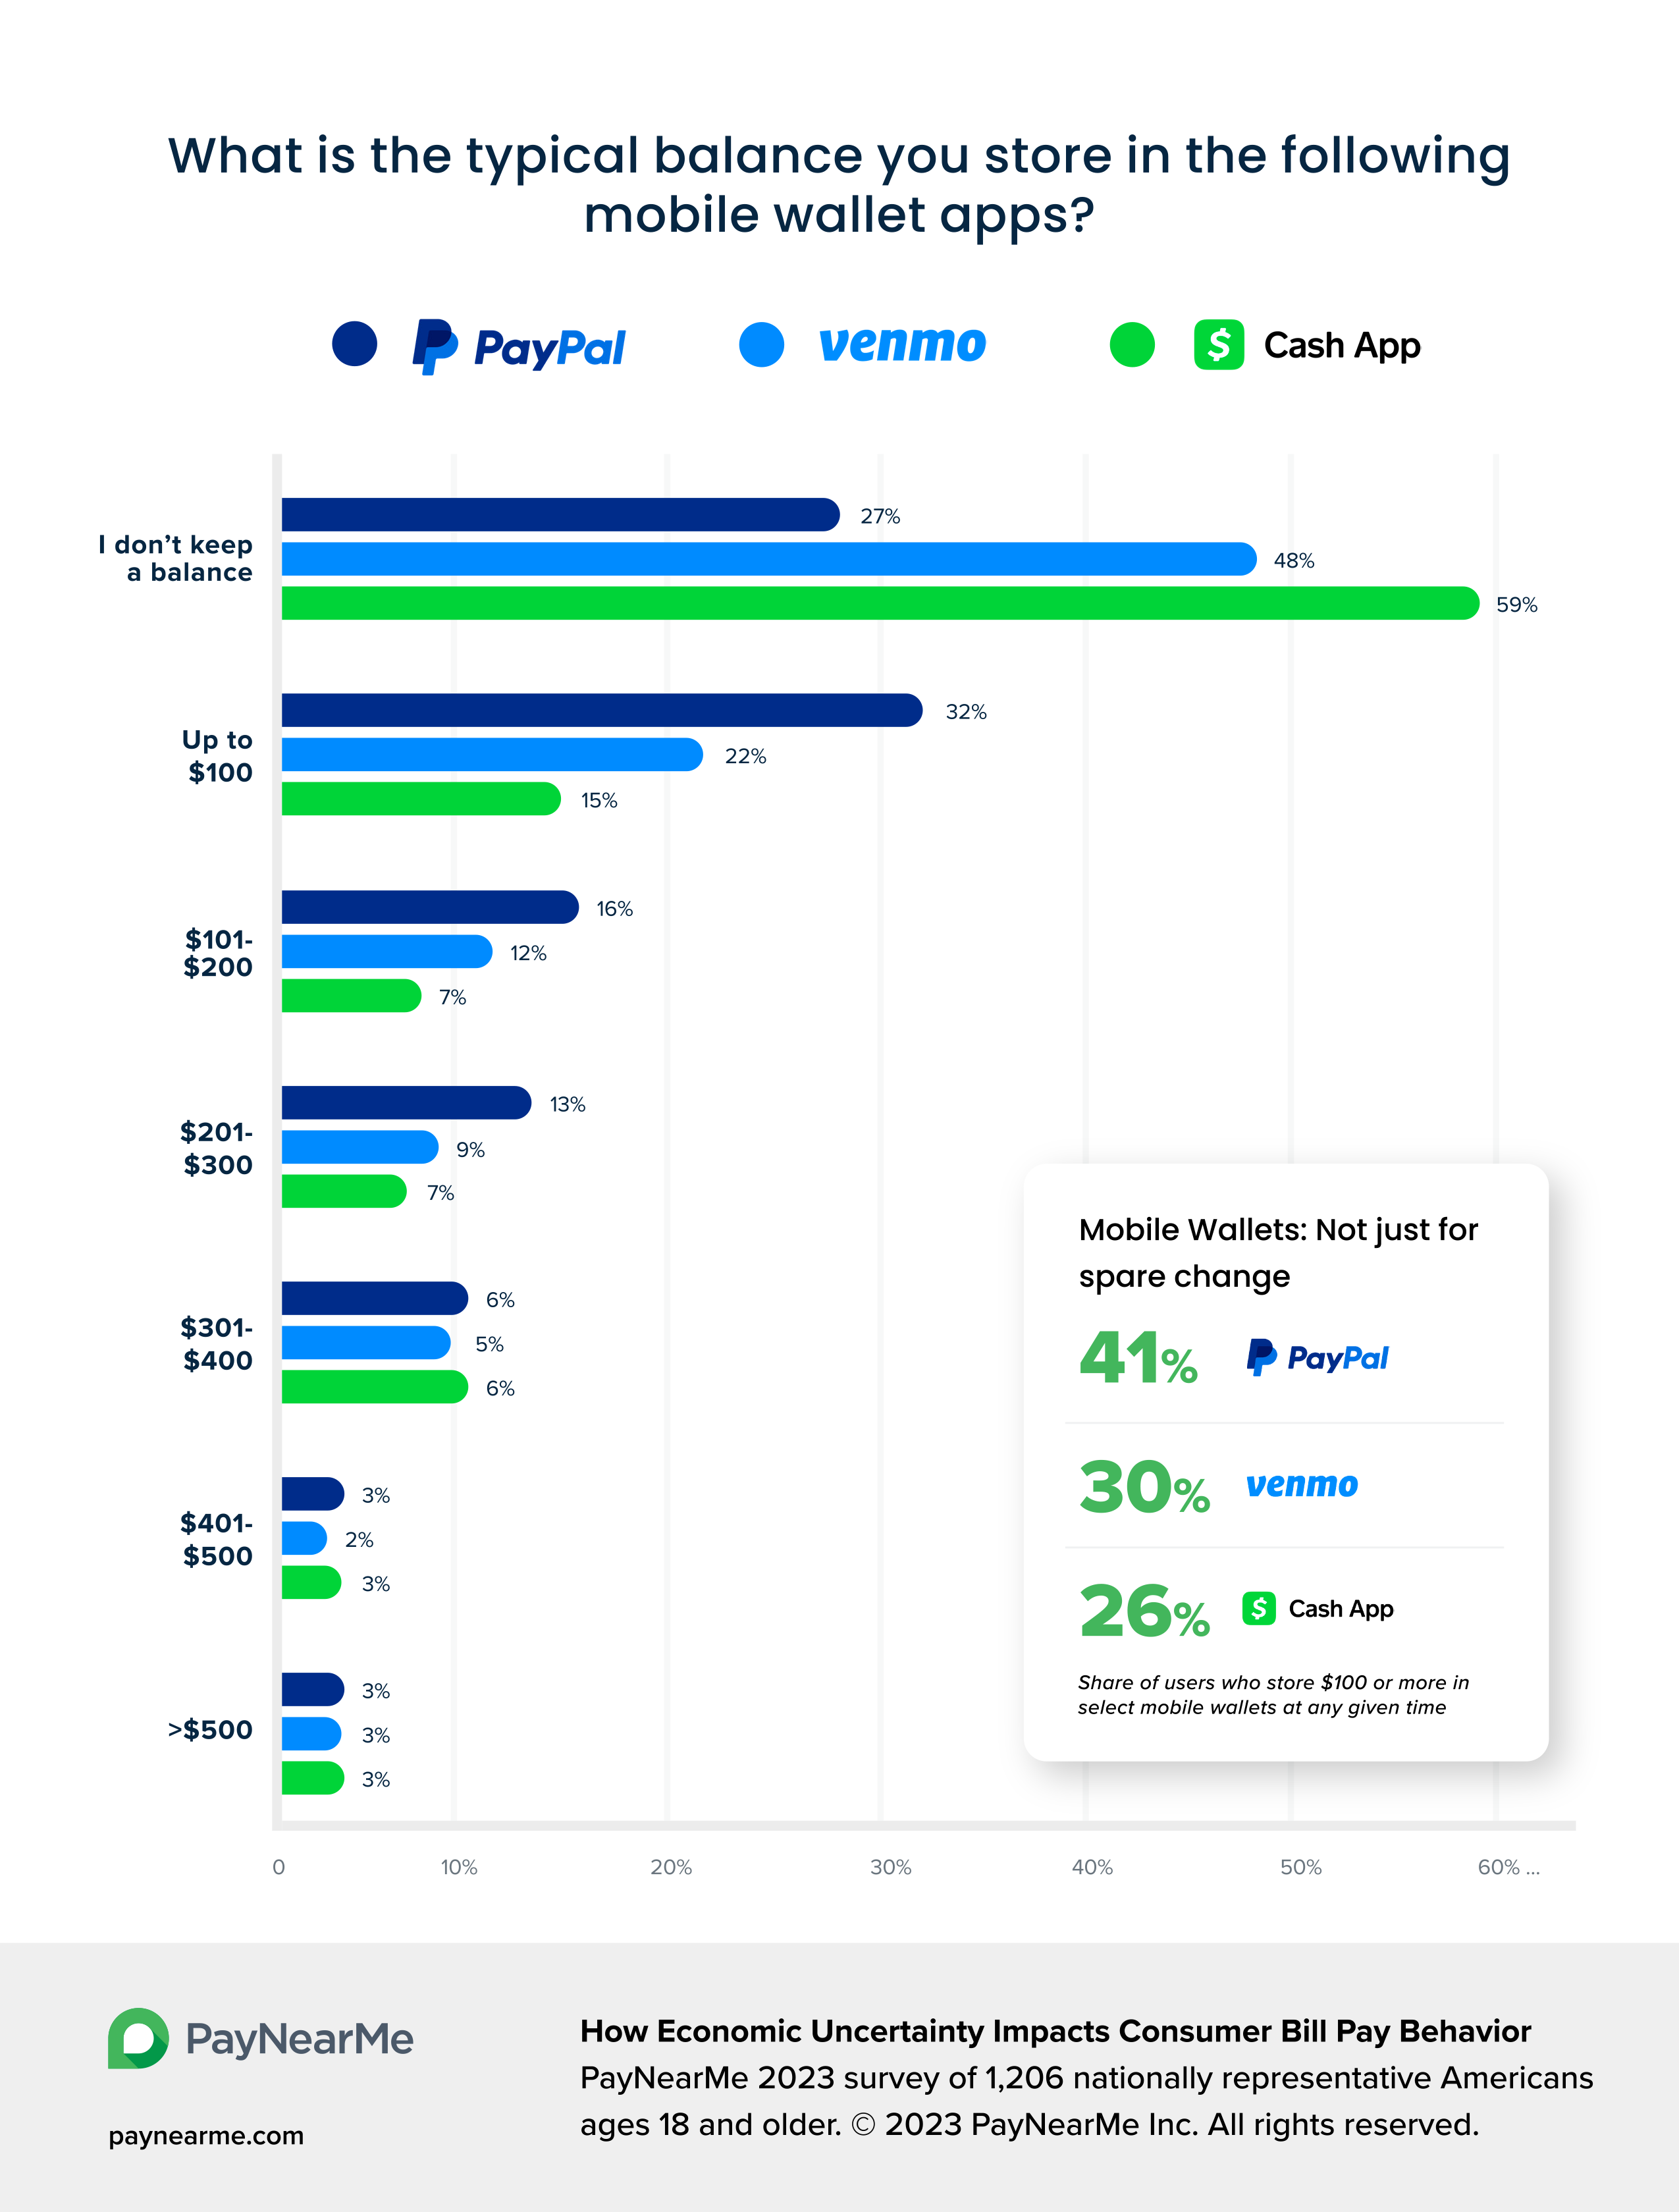
How Economic Uncertainty Impacts Bill Pay Behavior
This report explores how high inflation and economic uncertainty are causing consumers to question their ability to pay bills on time.


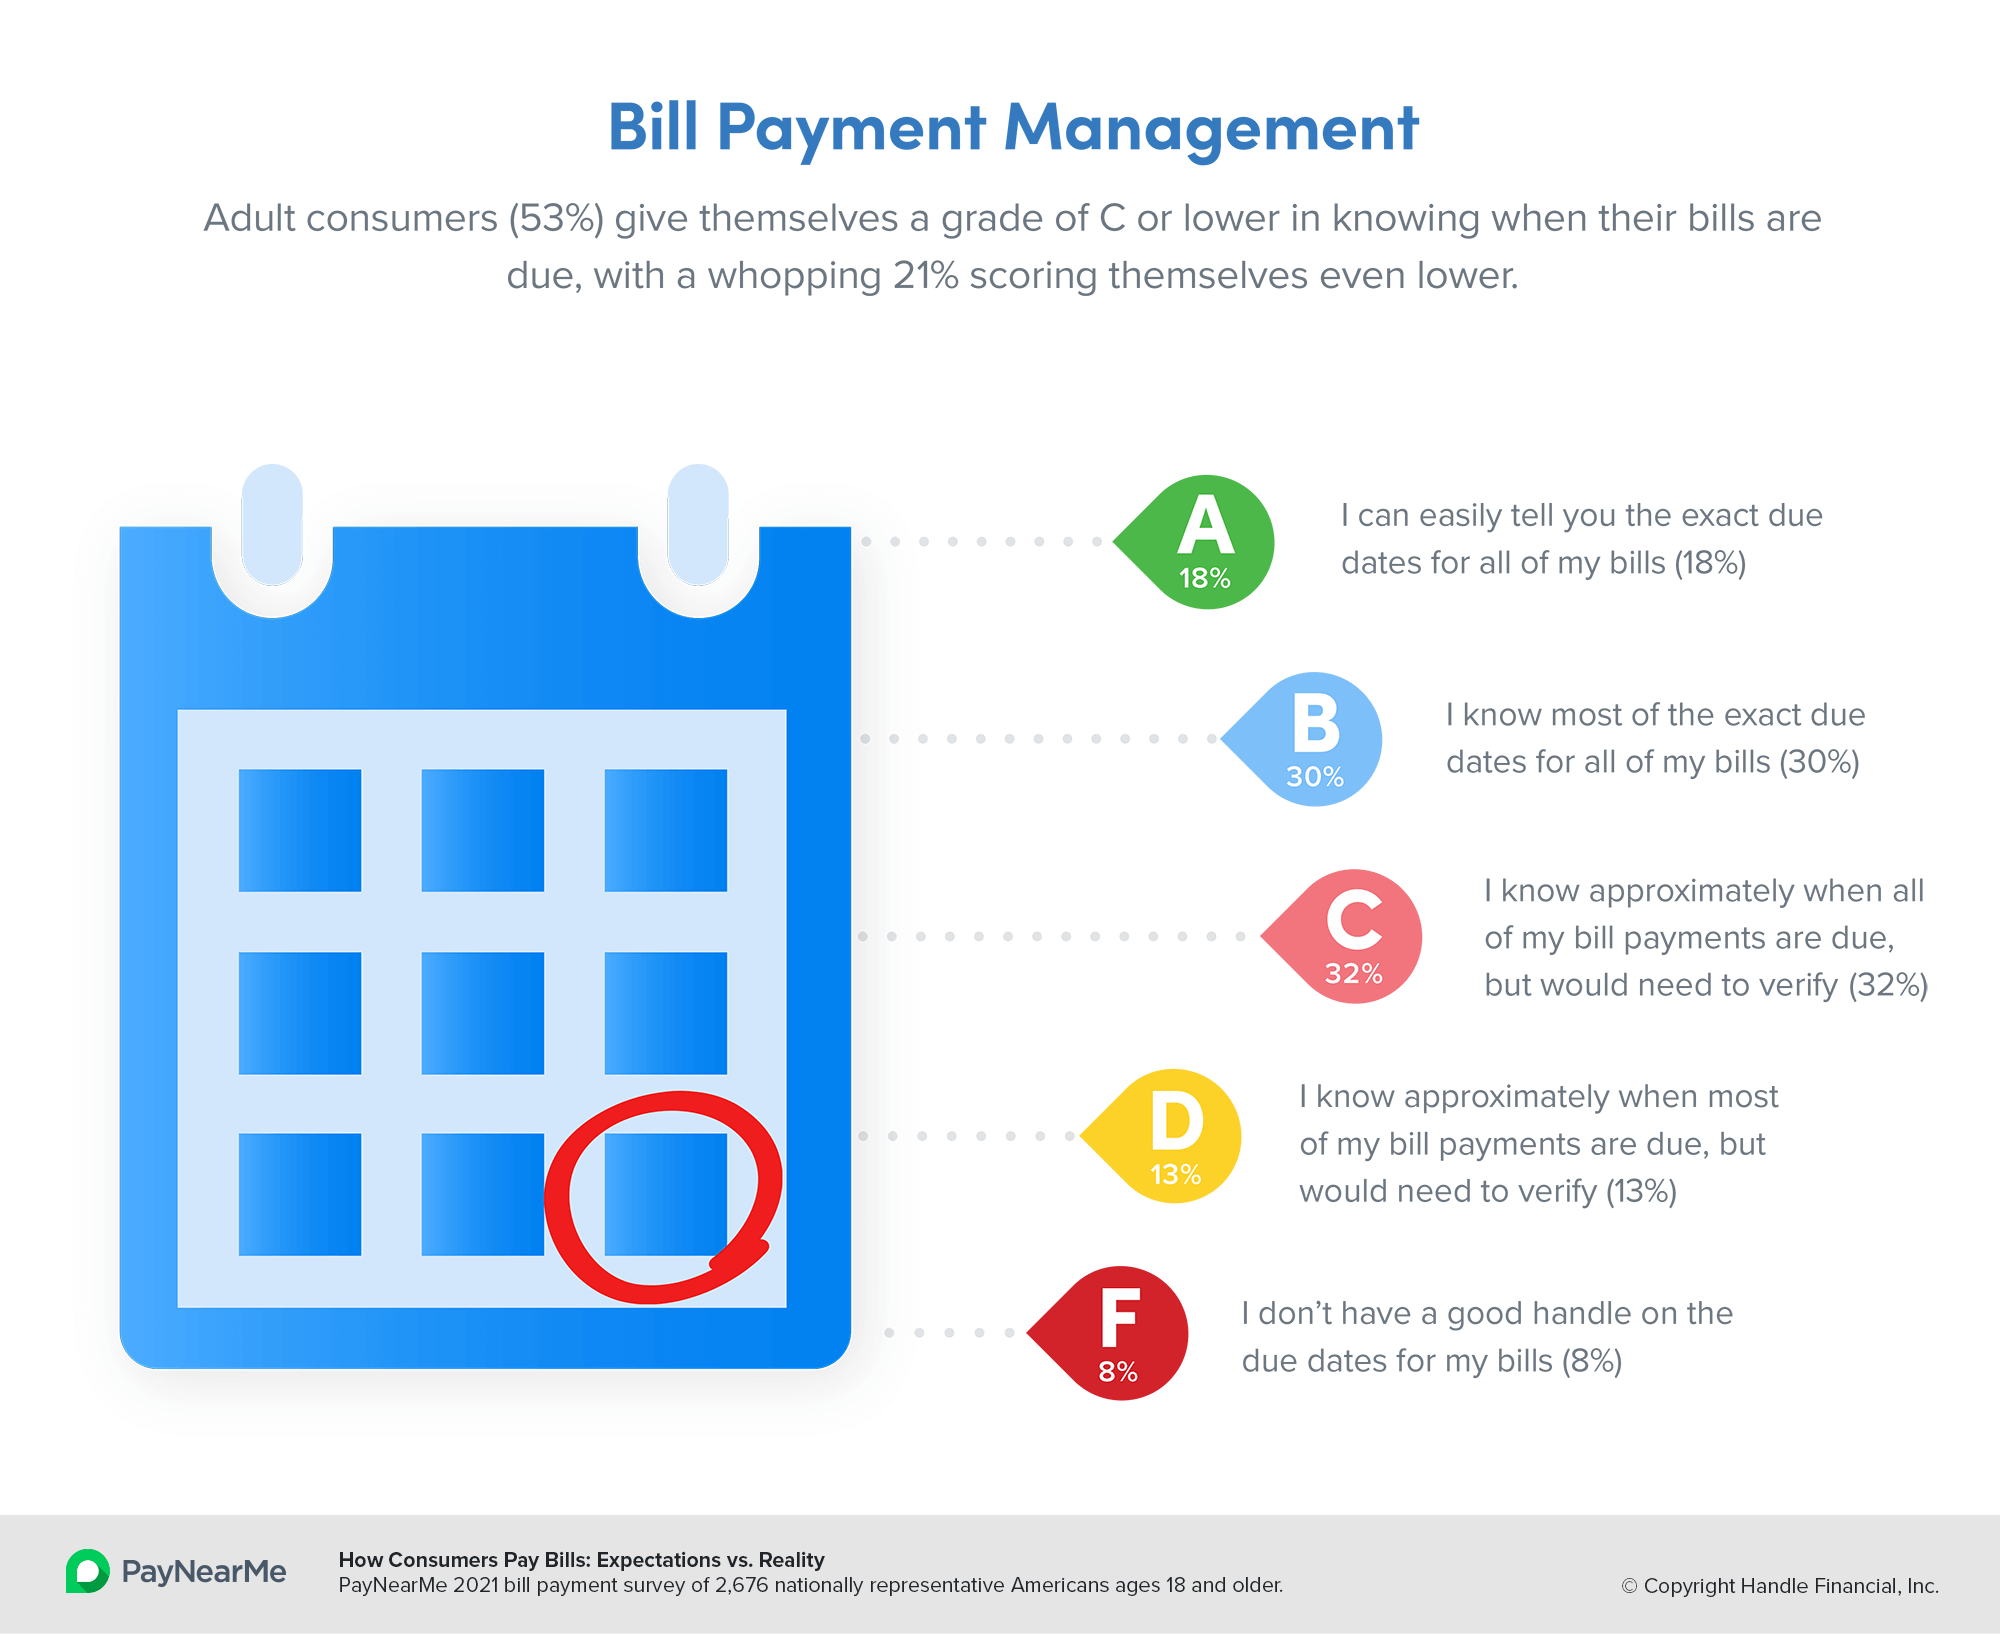
How Consumers Pay Bills: Expectations vs. Reality
Learn how payments innovation drives consumer expectations for bill payment—and how consumer preferences differ from established behaviors.


Why Consumers Pay Late
Learn why consumers pay bills late—and what you can do to encourage more on-time payments.
 How often consumers paid late in the past year
 How often consumers paid late, by age group
 Likelihood of delaying different kinds of bills
 The number of times different bills were delayed last year
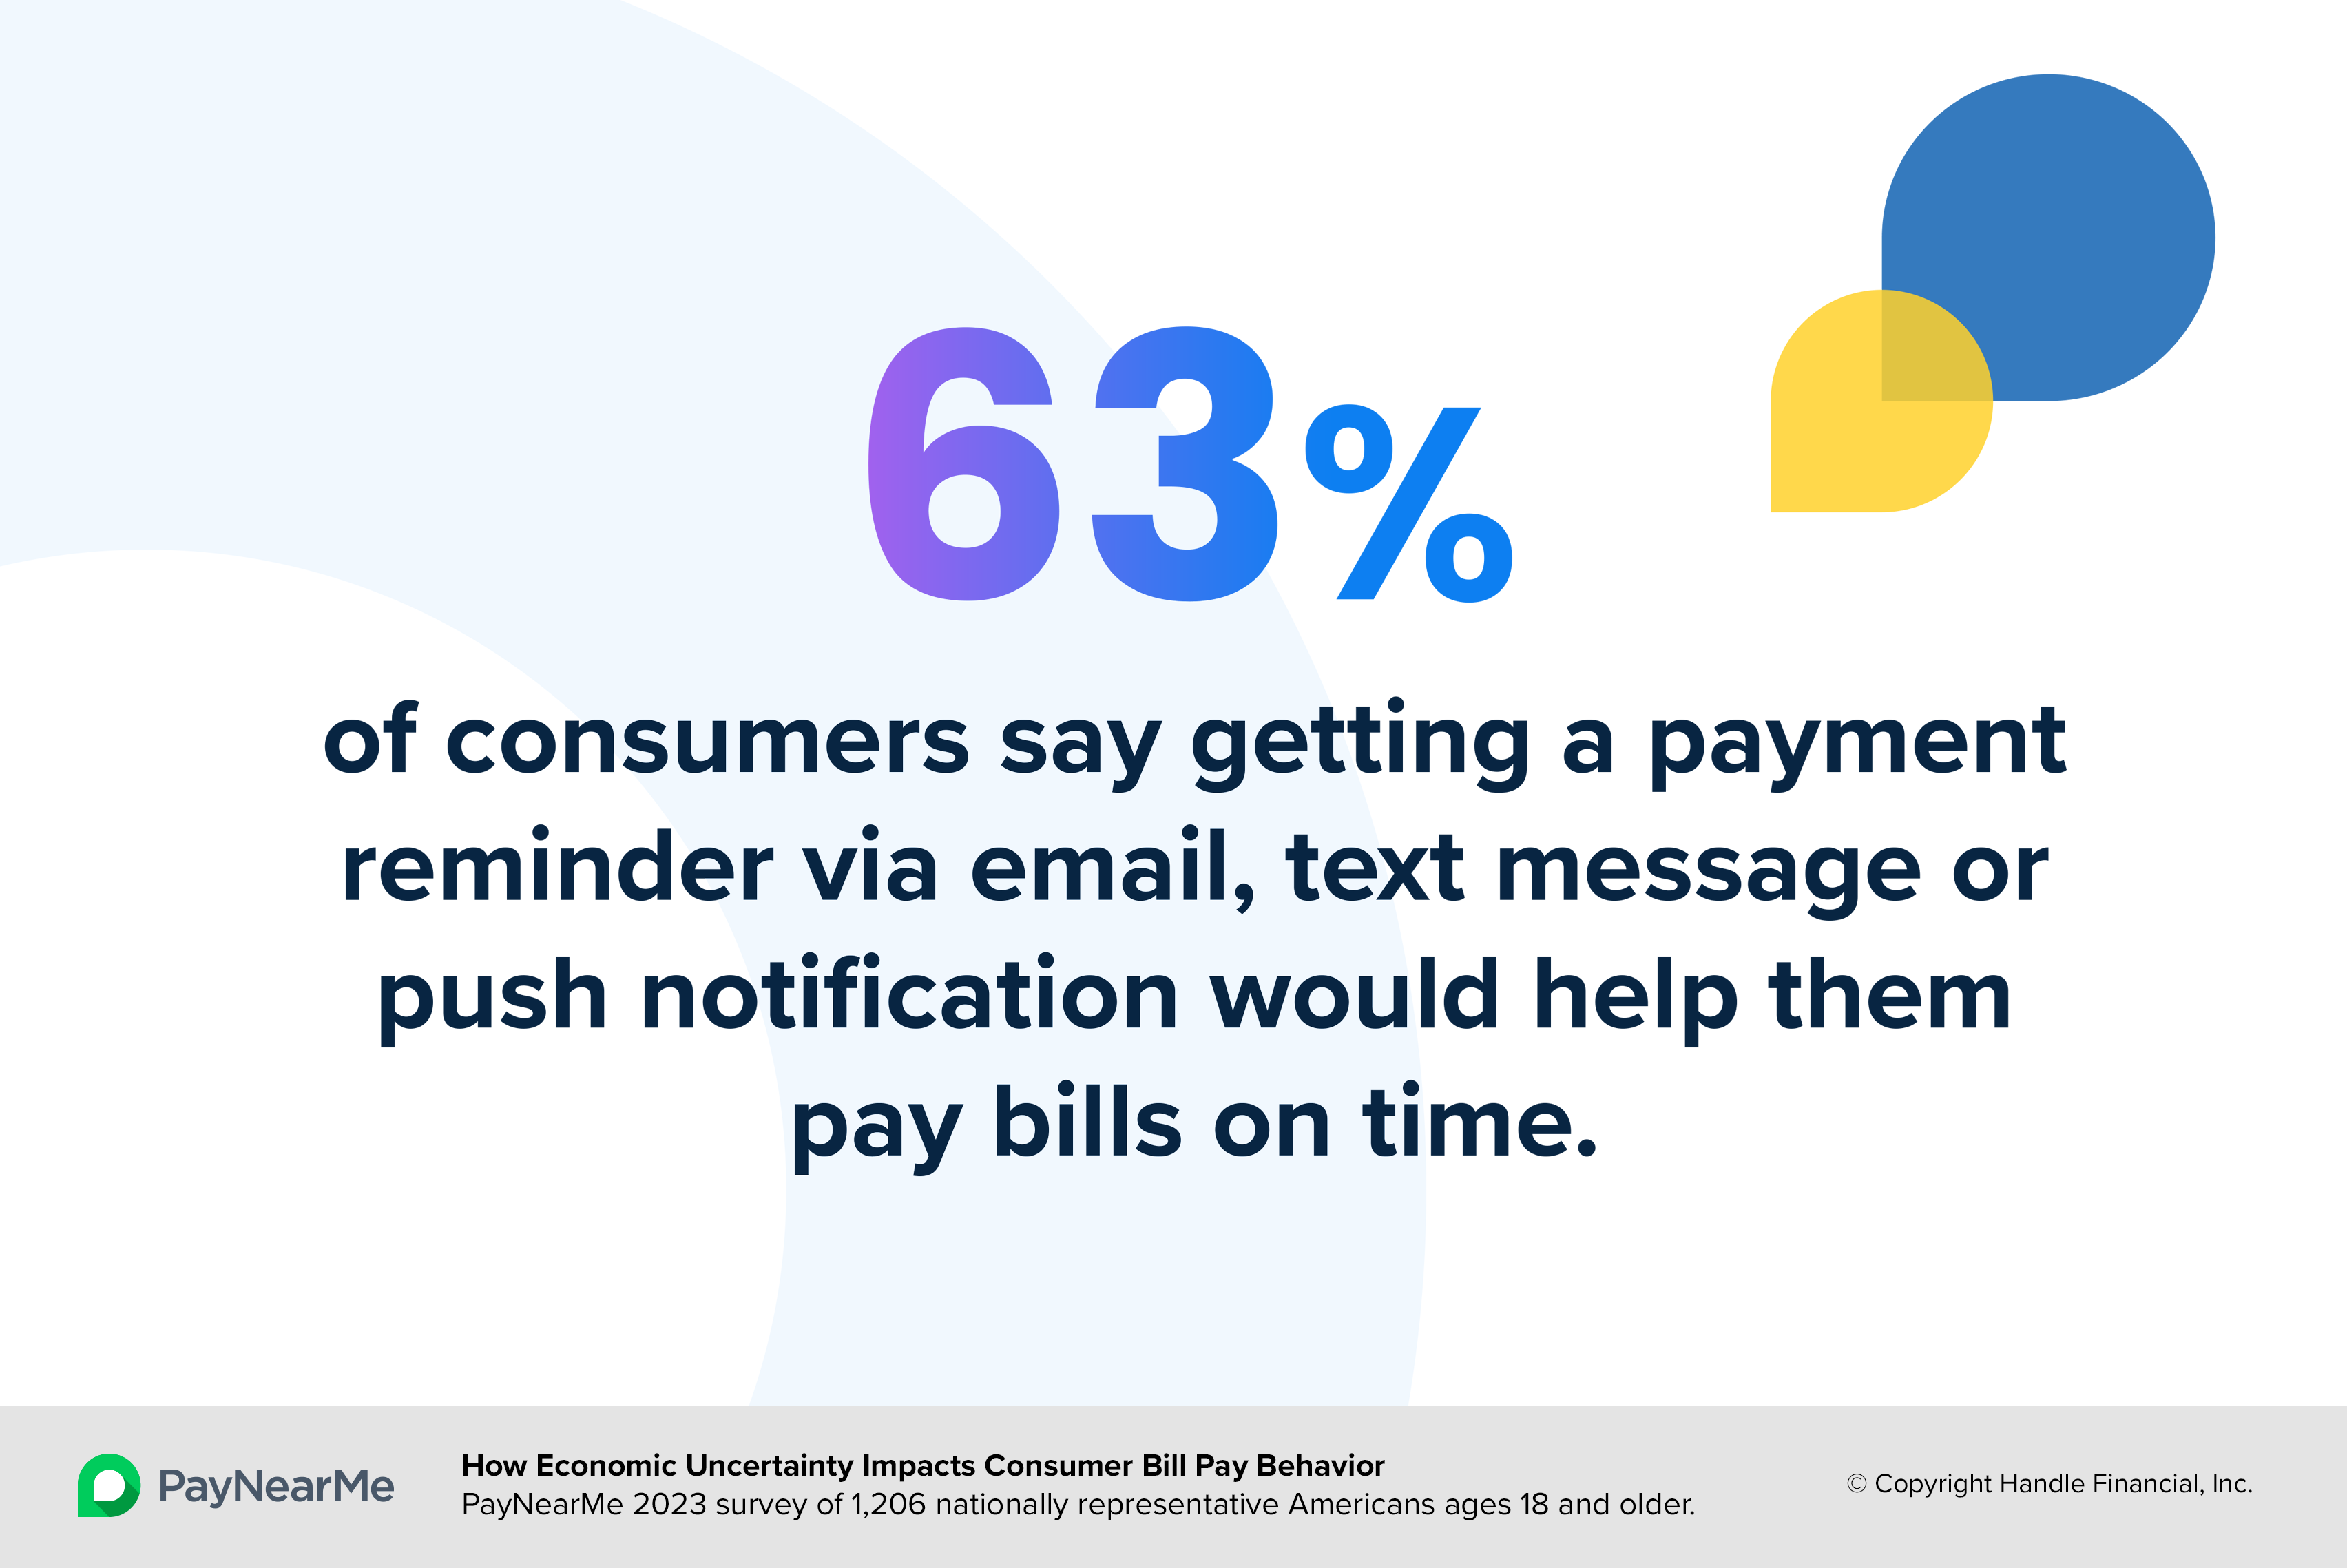
 The importance of payment reminders, by income level
 Reasons for late payments, by age group
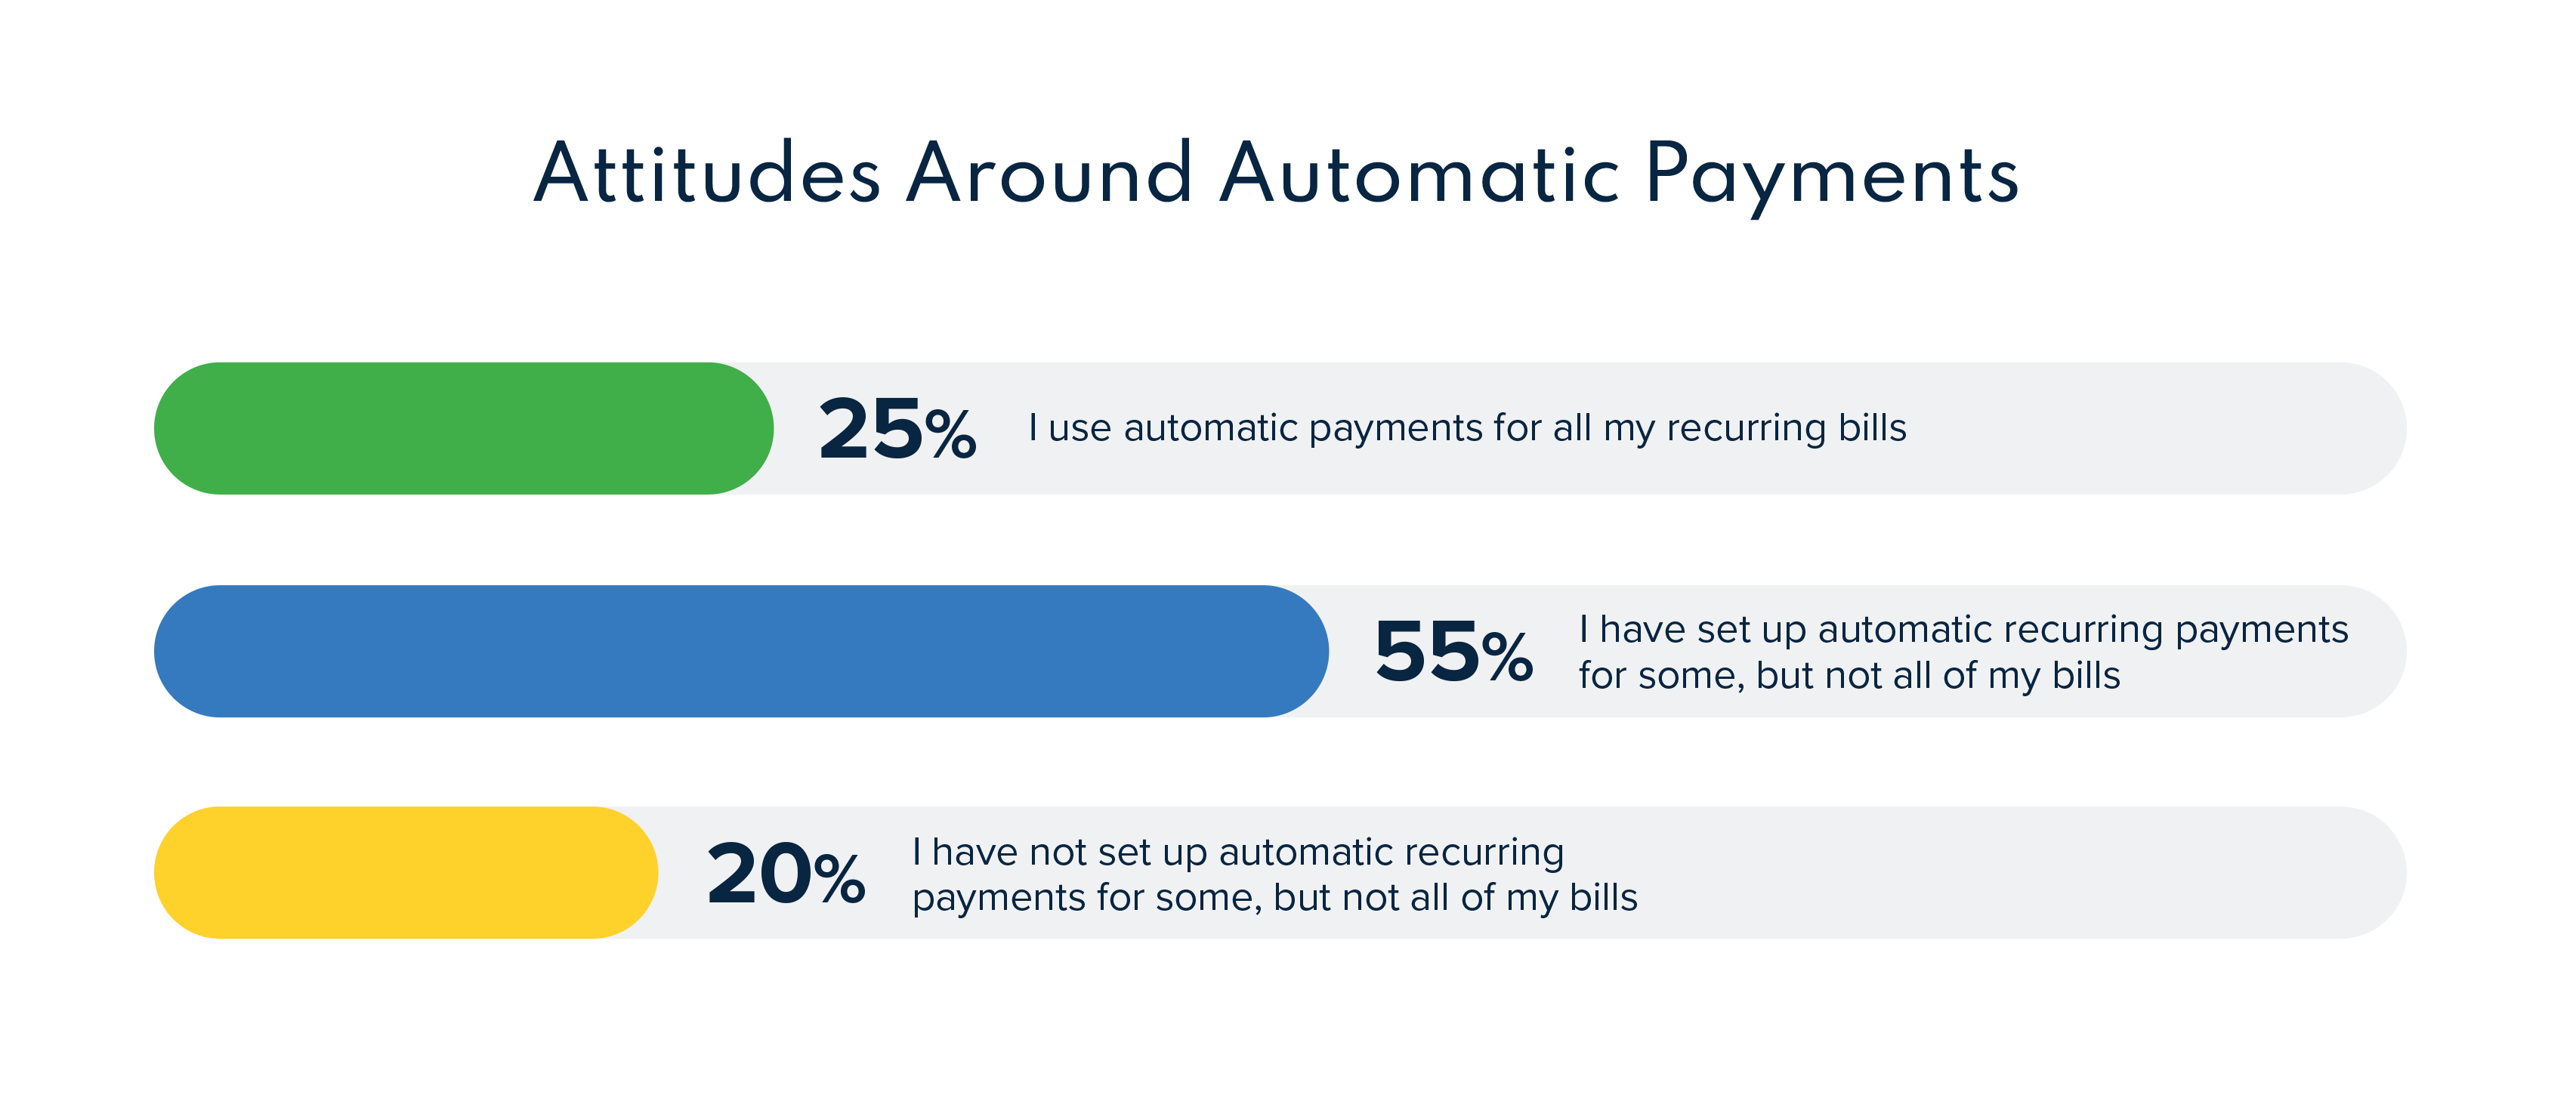
 Reasons for not setting up autopay
U.S. Consumers Expect More Mobile Options for Bill Pay
Explore the mobile bill payment options consumers are most excited about in this research report.